Fig. 14
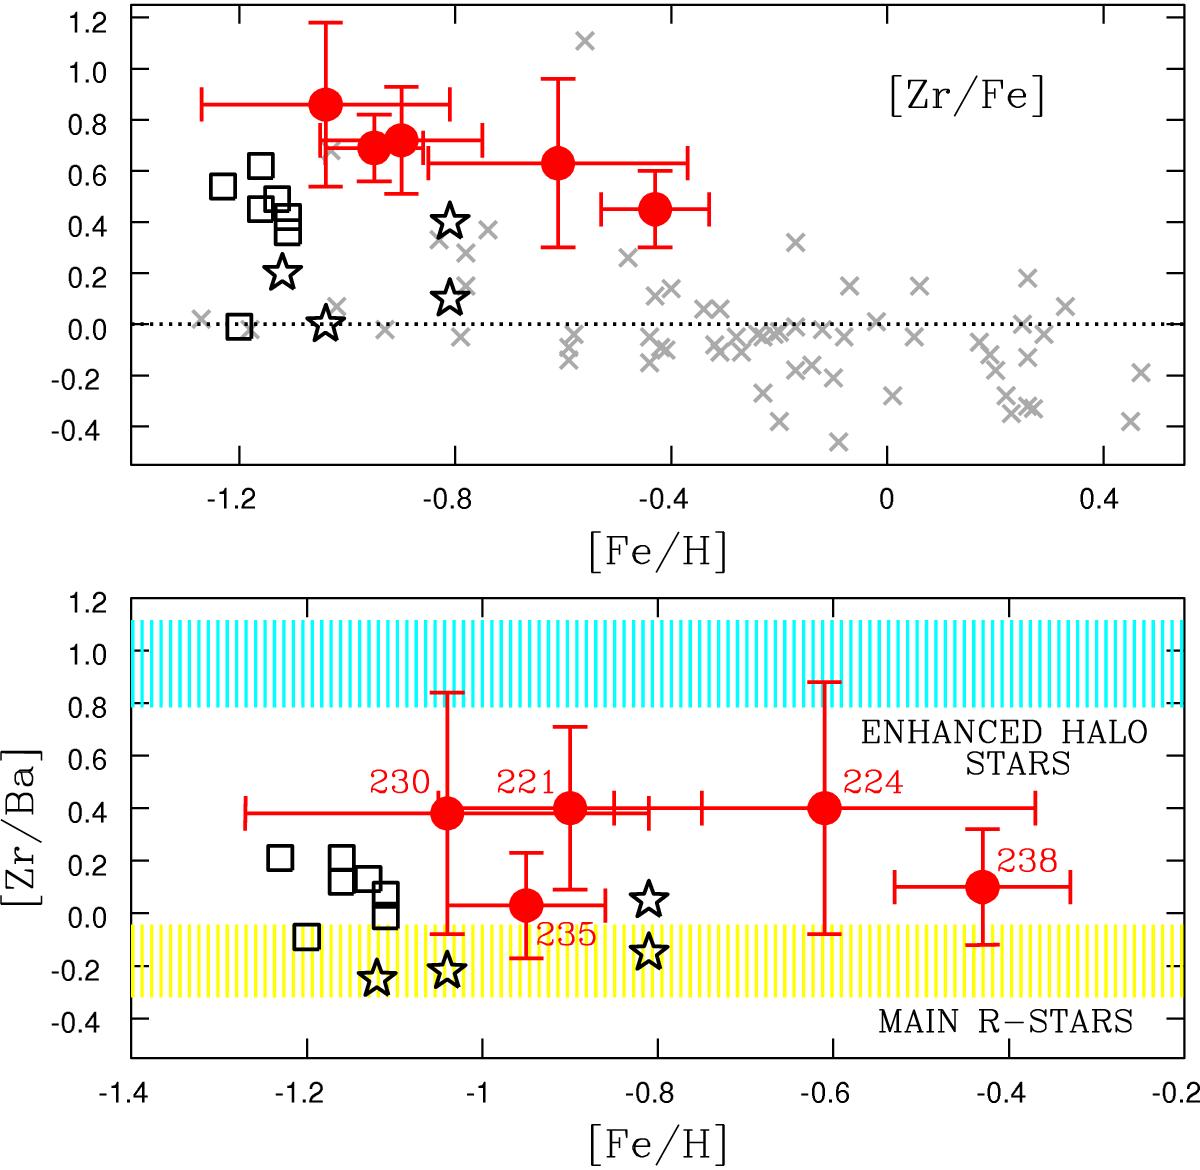
Upper panel: [Zr/Fe] abundance ratios as a function of the metallicity for the five sample stars, compared with literature abundances. Symbols are the same as in Figs. 8. Lower panel: [Zr/Ba] vs. [Fe/H] diagram for the sample stars and results from literature. Symbols are the same as in Figs. 8. The yellow and cyan regions correspond to the main r-process signature and the abundance ratio from metal-poor stars enhanced in the lightest heavy elements (see text for details).
Current usage metrics show cumulative count of Article Views (full-text article views including HTML views, PDF and ePub downloads, according to the available data) and Abstracts Views on Vision4Press platform.
Data correspond to usage on the plateform after 2015. The current usage metrics is available 48-96 hours after online publication and is updated daily on week days.
Initial download of the metrics may take a while.