Open Access
Fig. 8
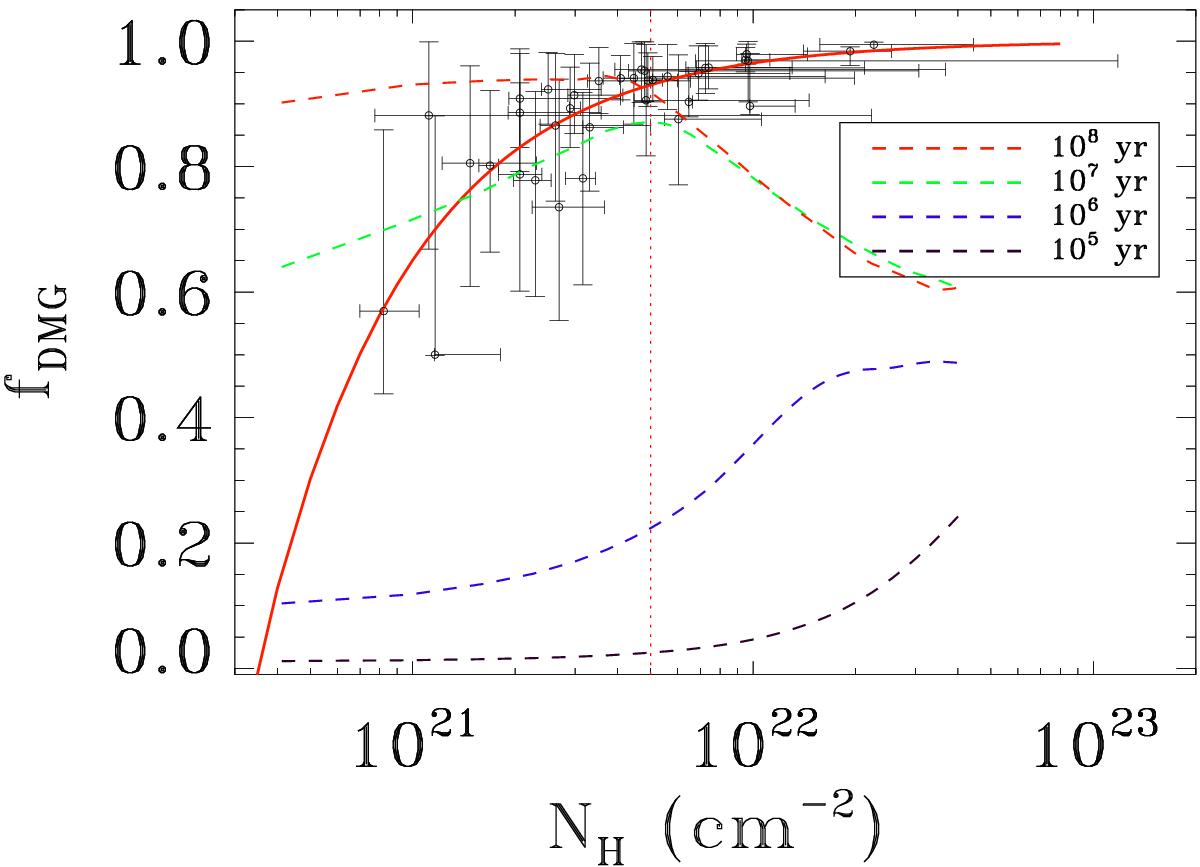
Fraction of DMG vs. hydrogen column density NH. Results for 36 sources are shown in open circles. Red solid line shows the best fitting. Dashed lines with different colors represent chemical evolutionary model results from Lee et al. (1996). Vertical dotted red line represents NH = 5 × 1021 cm-2.
Current usage metrics show cumulative count of Article Views (full-text article views including HTML views, PDF and ePub downloads, according to the available data) and Abstracts Views on Vision4Press platform.
Data correspond to usage on the plateform after 2015. The current usage metrics is available 48-96 hours after online publication and is updated daily on week days.
Initial download of the metrics may take a while.