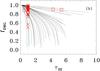
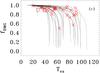
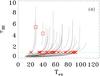
Fig. 6
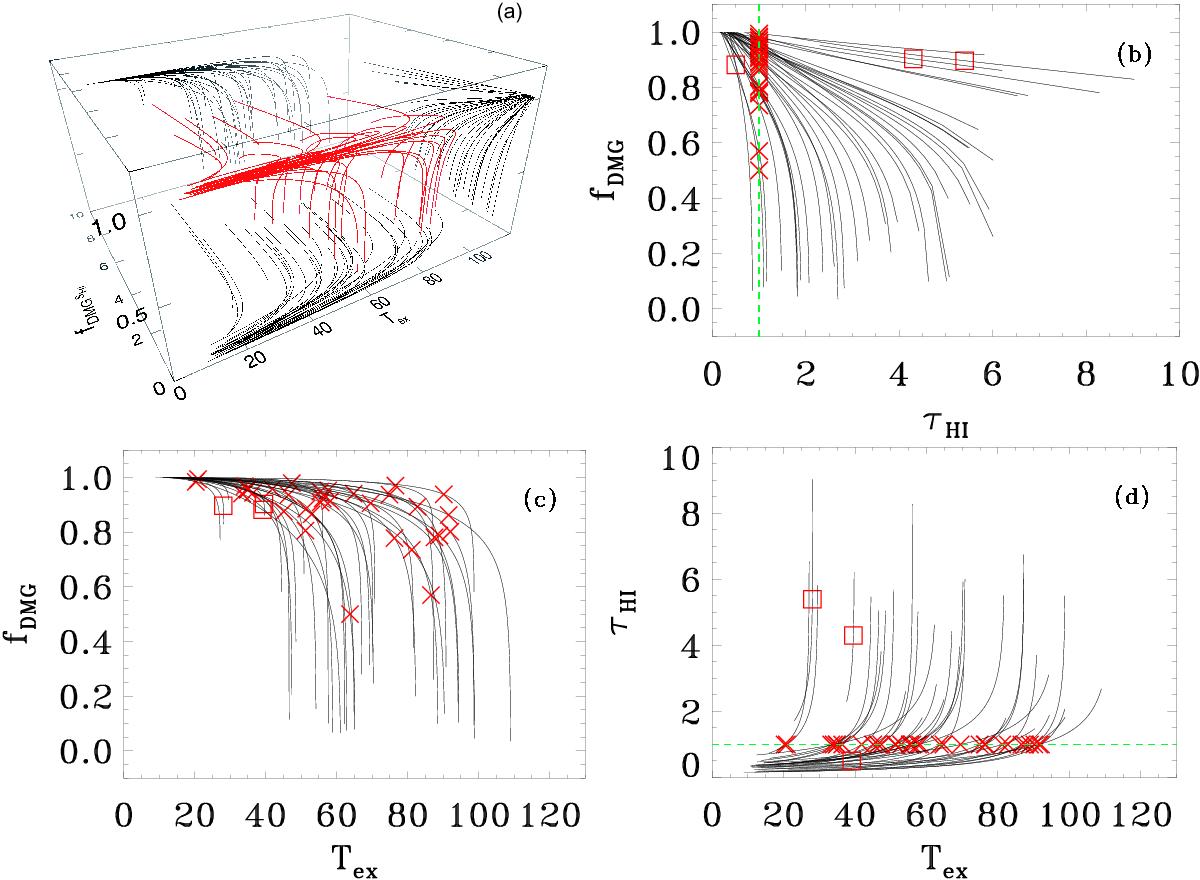
Relation curves between fDMG, τHi, and Tex. Panel a) shows 3D curves with red lines. Relations between each two parameters are projected with black lines. Panel b) shows relation between fDMG and τHi. The green dashed line represents τHi = 1. The value with τHi = 1 for 33 sources are indicated with red crosses, but for G132.5-1.0, G207.2-1.0, and G347.4+1.0, τHi = 5.4,4.3, and 0.5, respectively. They are shown with red squares. Panel c) shows the relation between fDMG and Tex. Panel d) shows the relation between τHi = 1 and Tex. The meaning of red crosses and blue dashed lines in panels c) and d) are same as in panel b).

Current usage metrics show cumulative count of Article Views (full-text article views including HTML views, PDF and ePub downloads, according to the available data) and Abstracts Views on Vision4Press platform.
Data correspond to usage on the plateform after 2015. The current usage metrics is available 48-96 hours after online publication and is updated daily on week days.
Initial download of the metrics may take a while.