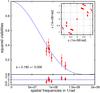
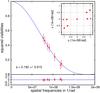
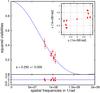
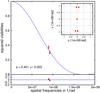
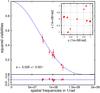
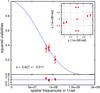
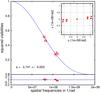
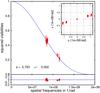
Fig. A.3

Observed calibrated squared visibilities (red dots) are plotted as a function of the spatial frequency for each pulsation phase (indicated in the lower left corner of each panel) together with the best fit of uniform disk model (solid blue line). In the upper right corner (inset panel) we show the corresponding (u,v) coverage.
Current usage metrics show cumulative count of Article Views (full-text article views including HTML views, PDF and ePub downloads, according to the available data) and Abstracts Views on Vision4Press platform.
Data correspond to usage on the plateform after 2015. The current usage metrics is available 48-96 hours after online publication and is updated daily on week days.
Initial download of the metrics may take a while.