Fig. 3
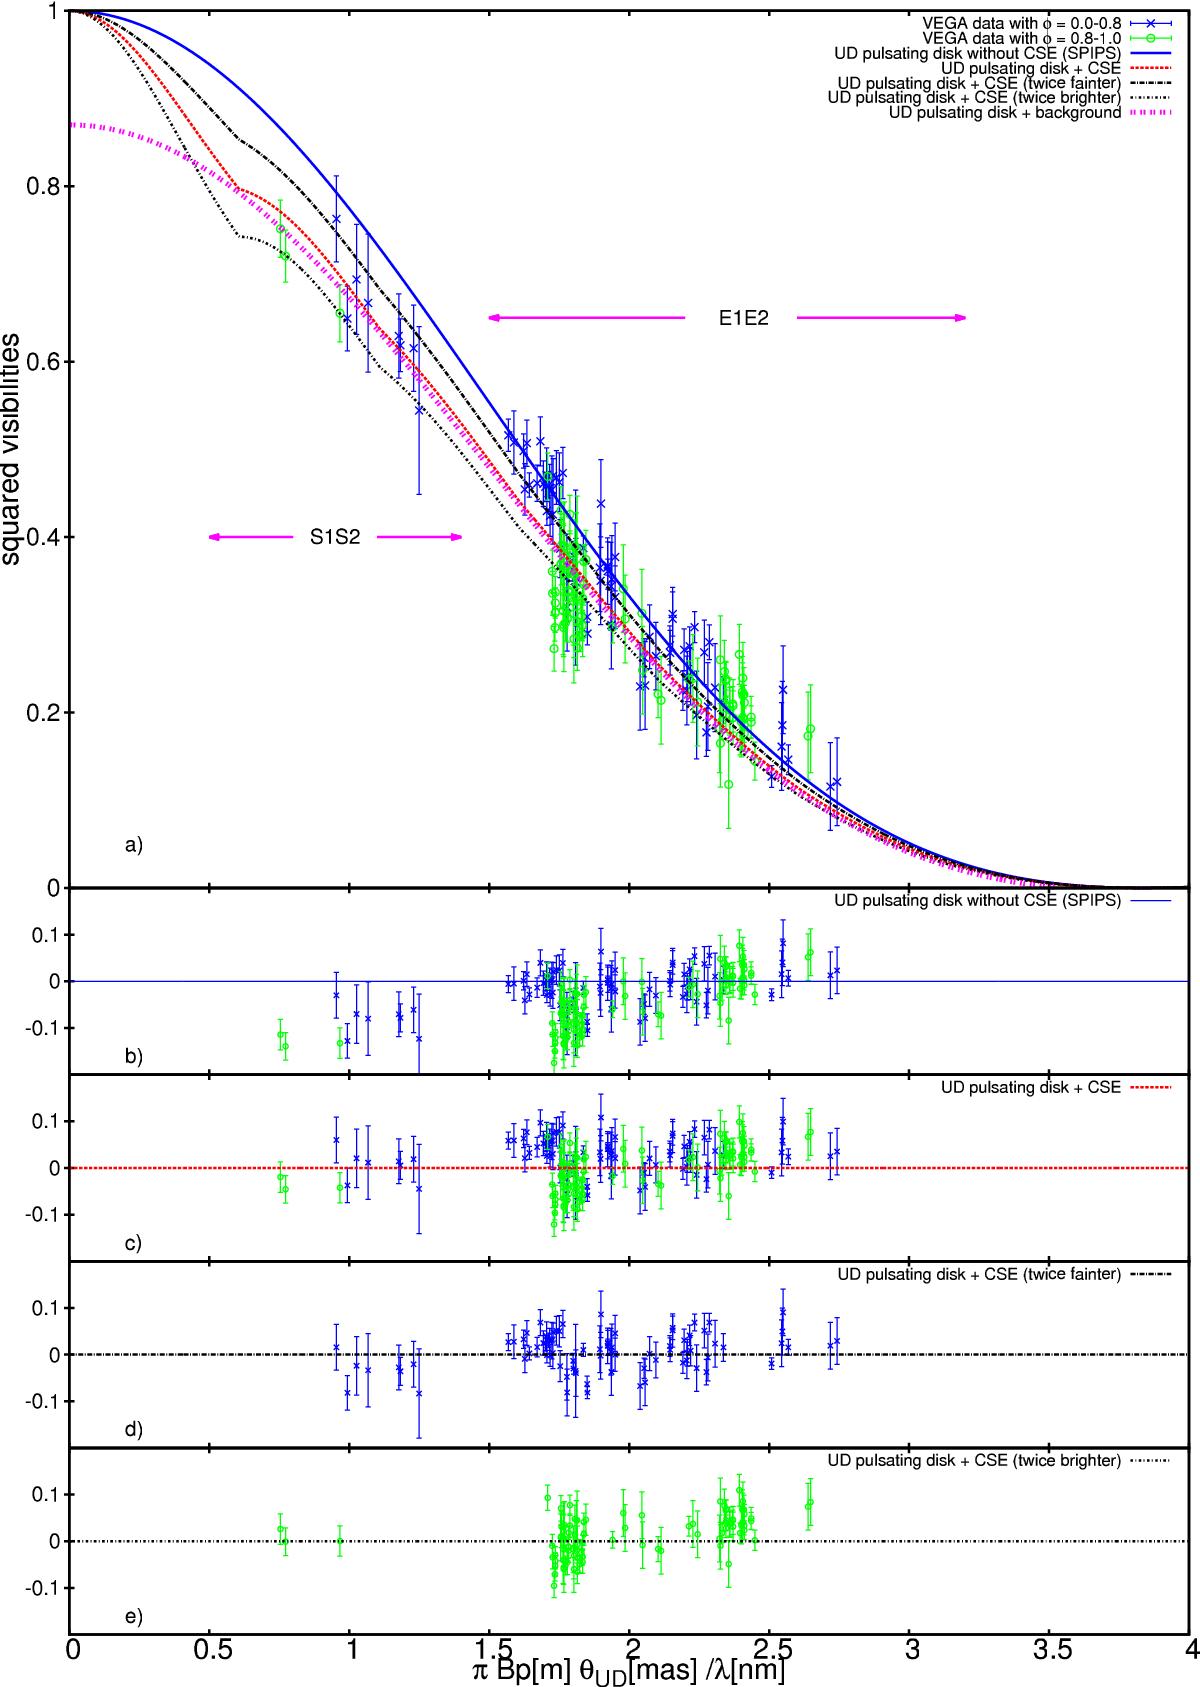
Panel a), the VEGA squared visibilities plotted as a function of ![]() in order to allow a comparison between data of different phases (i.e. different θUD) and effective wavelengths. Five models are overplotted: (1) the UD pulsating disk without CSE from the SPIPS algorithm (blue solid line); (2) the SPIPS UD pulsating disk + the CSE from Eq. (1) (red dotted line); (3) the SPIPS UD pulsating disk + the CSE from Eq. (1) but two times brighter (dashed line); (4) the SPIPS UD pulsating disk + the CSE or Eq. (1) but two times fainter (dash-dotted line); (5) the SPIPS UD pulsating disk + a background contribution filling the field of view of the interferometer (magenta dotted line). The residual between the observations and models 1 to 4 are shown in panels b), c), d), and e), respectively. In panels d) and e) we show only the data corresponding to phases intervals φ = 0.0−0.8 and φ = 0.8−1.0, respectively.
in order to allow a comparison between data of different phases (i.e. different θUD) and effective wavelengths. Five models are overplotted: (1) the UD pulsating disk without CSE from the SPIPS algorithm (blue solid line); (2) the SPIPS UD pulsating disk + the CSE from Eq. (1) (red dotted line); (3) the SPIPS UD pulsating disk + the CSE from Eq. (1) but two times brighter (dashed line); (4) the SPIPS UD pulsating disk + the CSE or Eq. (1) but two times fainter (dash-dotted line); (5) the SPIPS UD pulsating disk + a background contribution filling the field of view of the interferometer (magenta dotted line). The residual between the observations and models 1 to 4 are shown in panels b), c), d), and e), respectively. In panels d) and e) we show only the data corresponding to phases intervals φ = 0.0−0.8 and φ = 0.8−1.0, respectively.
Current usage metrics show cumulative count of Article Views (full-text article views including HTML views, PDF and ePub downloads, according to the available data) and Abstracts Views on Vision4Press platform.
Data correspond to usage on the plateform after 2015. The current usage metrics is available 48-96 hours after online publication and is updated daily on week days.
Initial download of the metrics may take a while.