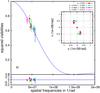
Fig. 2
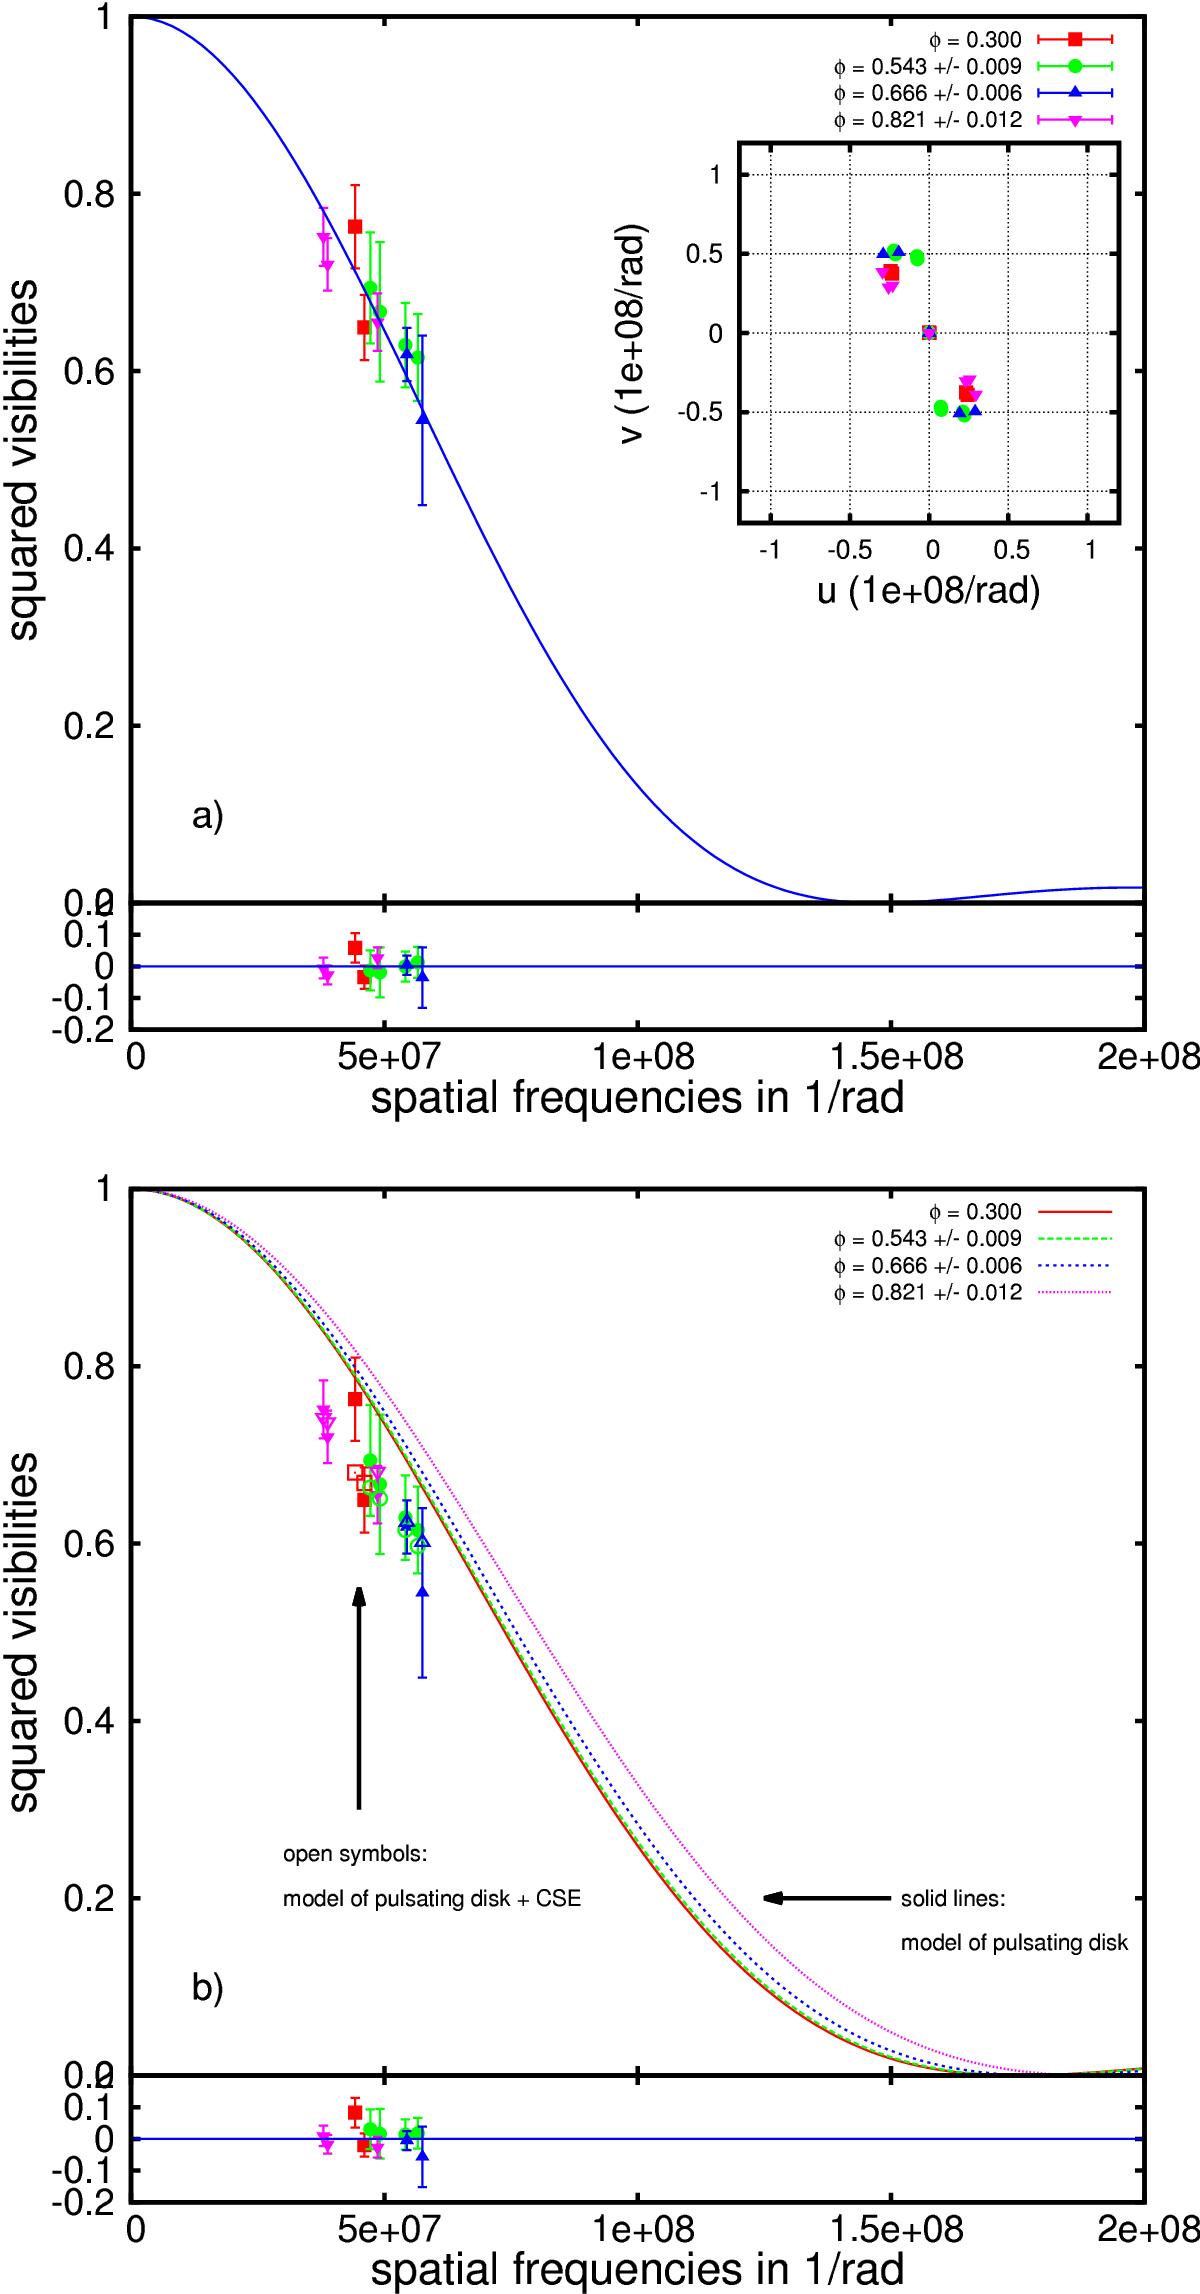
a) S1S2 observed calibrated squared visibilities secured at four different pulsation phases plotted as a function of the spatial frequency together with the best fit of uniform disk model (solid blue line). In the upper right corner we show the corresponding (u,v) coverage. b) Same data fitted with a two-component model (open symbols) including a uniform pulsating disk and a CSE (see text). As a comparison, the solid lines are the corresponding one-component models, i.e. a uniform pulsating disk (in the R band) without the CSE.
Current usage metrics show cumulative count of Article Views (full-text article views including HTML views, PDF and ePub downloads, according to the available data) and Abstracts Views on Vision4Press platform.
Data correspond to usage on the plateform after 2015. The current usage metrics is available 48-96 hours after online publication and is updated daily on week days.
Initial download of the metrics may take a while.