Fig. 1
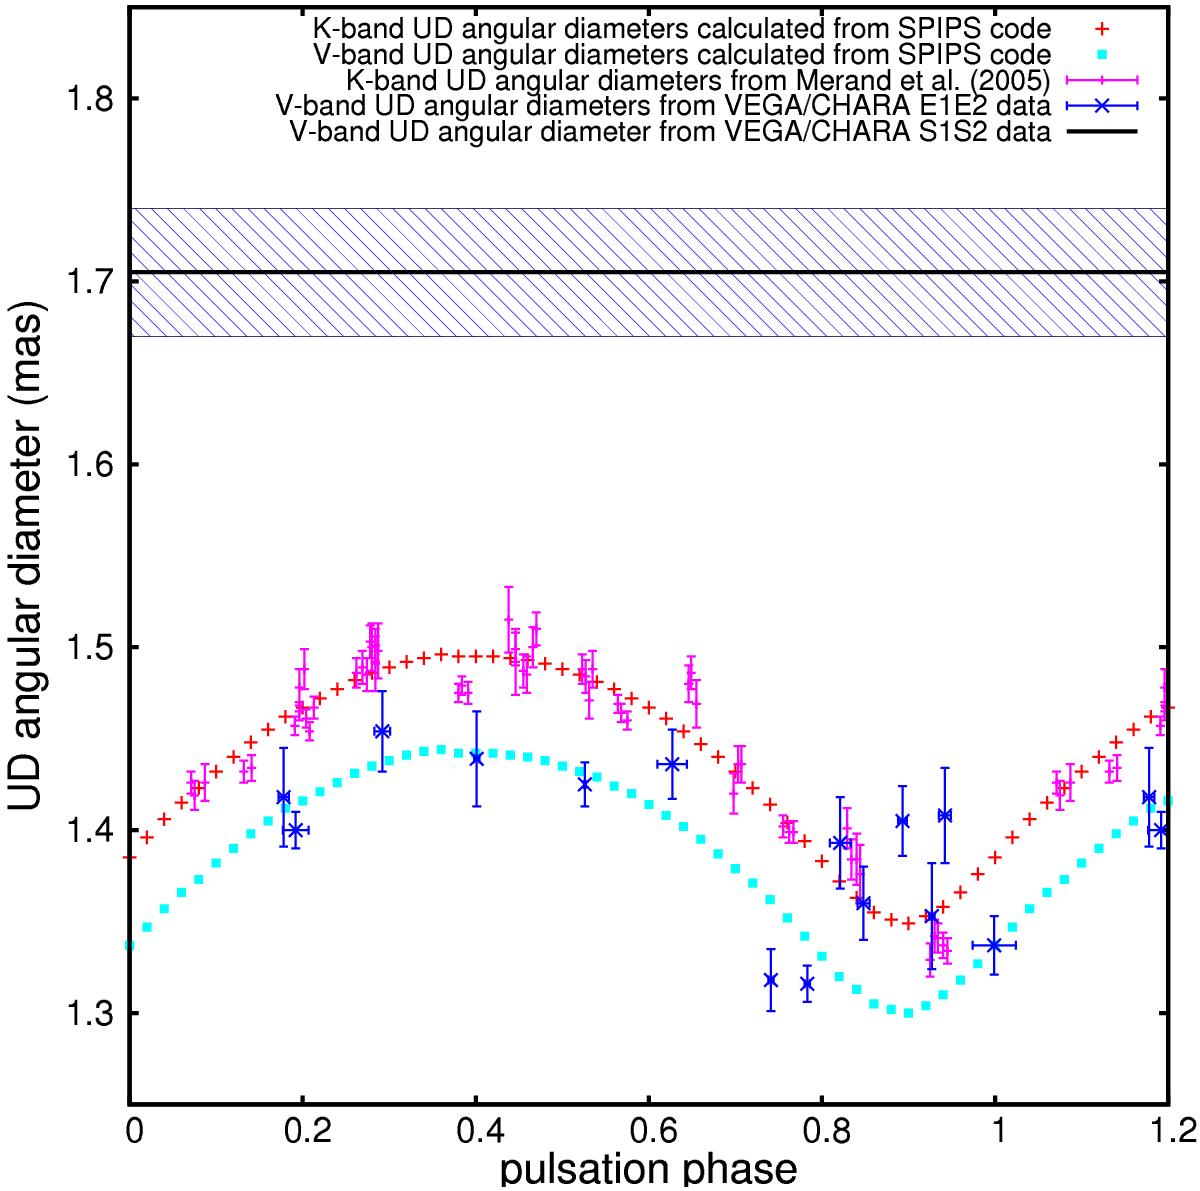
Uniform disk diameters θUD derived from the VEGA/CHARA E1E2 data plotted as a function of the pulsation phase (blue crosses). The S1S2 data (corresponding to four different pulsation phases, see Table 3) were merged and the corresponding mean θUD is represented by a black horizontal line together with the 1σ uncertainty (blue dashed zone). The uniform disk angular diameter curve from FLUOR/CHARA in the K band (Mérand et al. 2005) is also shown for comparison. The red crosses and the light blue squares show the K band and R band UD angular diameter curves, respectively, as predicted from the SPIPS code (Merand et al. 2015a).
Current usage metrics show cumulative count of Article Views (full-text article views including HTML views, PDF and ePub downloads, according to the available data) and Abstracts Views on Vision4Press platform.
Data correspond to usage on the plateform after 2015. The current usage metrics is available 48-96 hours after online publication and is updated daily on week days.
Initial download of the metrics may take a while.