Fig. 9
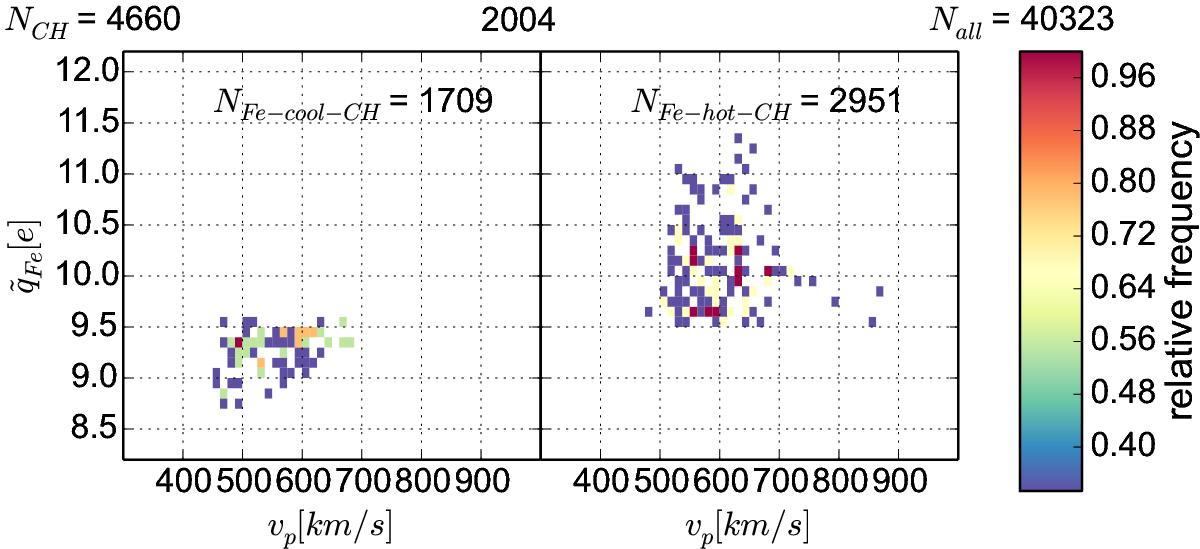
Average charge-state (![]() ) versus solar wind proton speed for Fe-cool and Fe-hot coronal-hole type wind for 2004. The color gradient indicates the frequency of observing each charge-state-solar wind speed pair in 2004 and is normalized to the maximum in each panel. Each data point represents a four-hour average. The inset in each panel gives the number of data points in 12-min resolution that contributed to the averages in in this figure. The number (Nall) of all 12-min resolution data points in 2004 is given on the top right and the number (NCH) of all data points categorized as pure coronal-hole wind, in the top left.
) versus solar wind proton speed for Fe-cool and Fe-hot coronal-hole type wind for 2004. The color gradient indicates the frequency of observing each charge-state-solar wind speed pair in 2004 and is normalized to the maximum in each panel. Each data point represents a four-hour average. The inset in each panel gives the number of data points in 12-min resolution that contributed to the averages in in this figure. The number (Nall) of all 12-min resolution data points in 2004 is given on the top right and the number (NCH) of all data points categorized as pure coronal-hole wind, in the top left.
Current usage metrics show cumulative count of Article Views (full-text article views including HTML views, PDF and ePub downloads, according to the available data) and Abstracts Views on Vision4Press platform.
Data correspond to usage on the plateform after 2015. The current usage metrics is available 48-96 hours after online publication and is updated daily on week days.
Initial download of the metrics may take a while.