Fig. 6
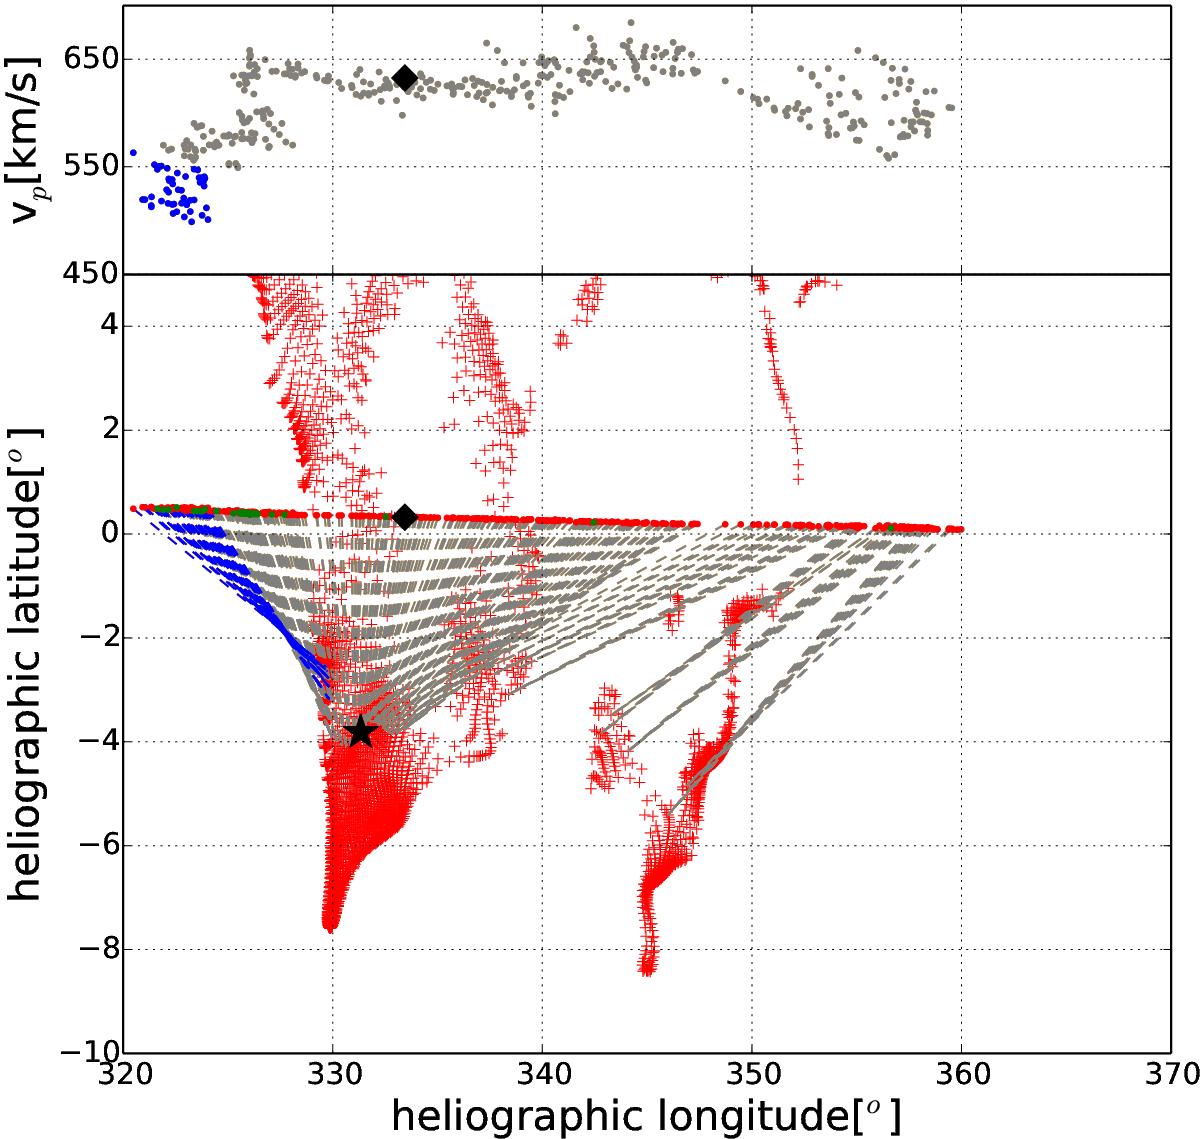
Section of a heliographic map based on MDI magnetograms for Carrington rotation 2044. The first part of the highlighted part of the stream in Fig. 5 is omitted because it is part of the previous Carrington rotation. The top panel shows the solar-wind proton speed (vp) plotted against the mapped back heliographic longitude on the source surface. Below, the dotted line shows the corresponding footpoints of ACE for DoY 158.4−162 on the source surface in heliographic coordinates. The color of each footpoint on the source surface corresponds to the magnetic-field polarity observed at ACE. The polarity is plotted in 12-min time resolution. These footpoints are then traced down to the photosphere with a PFSS model. The dashed lines connect the positions of the ACE footpoints on the source surface to the corresponding footpoints on the photosphere. Footpoints of open field lines in the photosphere are indicated with + symbols (red). The transition between the Fe-hot coronal-hole wind and the Fe-cool coronal-hole wind is marked with a black diamond on the source surface (and in the first panel) and with a black star on the photosphere.
Current usage metrics show cumulative count of Article Views (full-text article views including HTML views, PDF and ePub downloads, according to the available data) and Abstracts Views on Vision4Press platform.
Data correspond to usage on the plateform after 2015. The current usage metrics is available 48-96 hours after online publication and is updated daily on week days.
Initial download of the metrics may take a while.