Fig. 4
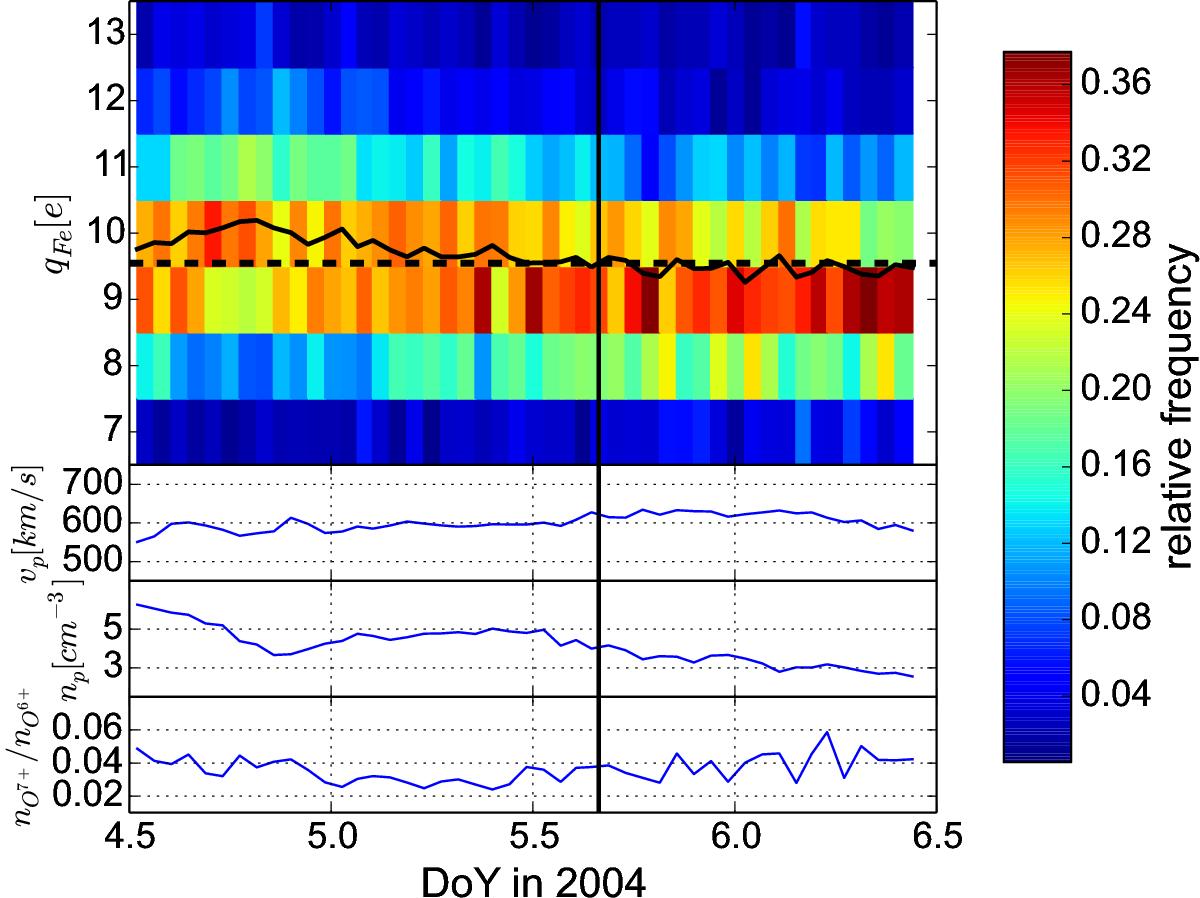
Time series of Fe charge-state distributions (first panel) for the highlighted time period from Fig. 2, that is, DoY 4.5−6.5 in 2004, in one-hour time resolution. In black, the average charge-state (that is, ![]() ) is shown in units of the elementary electric charge e.Each charge-state distribution is normalized to the sum. Below, the solar wind proton speed (second panel) and proton density (third panel) are given as reference. In the bottom panel the ratio nO7 +/nO6 + is shown as well.The threshold value between Fe-cool and Fe-hot wind is shown as a horizontal dashed line and the transition between Fe-hot and Fe-cool coronal-hole wind is marked with a vertical black line in all panels.
) is shown in units of the elementary electric charge e.Each charge-state distribution is normalized to the sum. Below, the solar wind proton speed (second panel) and proton density (third panel) are given as reference. In the bottom panel the ratio nO7 +/nO6 + is shown as well.The threshold value between Fe-cool and Fe-hot wind is shown as a horizontal dashed line and the transition between Fe-hot and Fe-cool coronal-hole wind is marked with a vertical black line in all panels.
Current usage metrics show cumulative count of Article Views (full-text article views including HTML views, PDF and ePub downloads, according to the available data) and Abstracts Views on Vision4Press platform.
Data correspond to usage on the plateform after 2015. The current usage metrics is available 48-96 hours after online publication and is updated daily on week days.
Initial download of the metrics may take a while.