Fig. 3
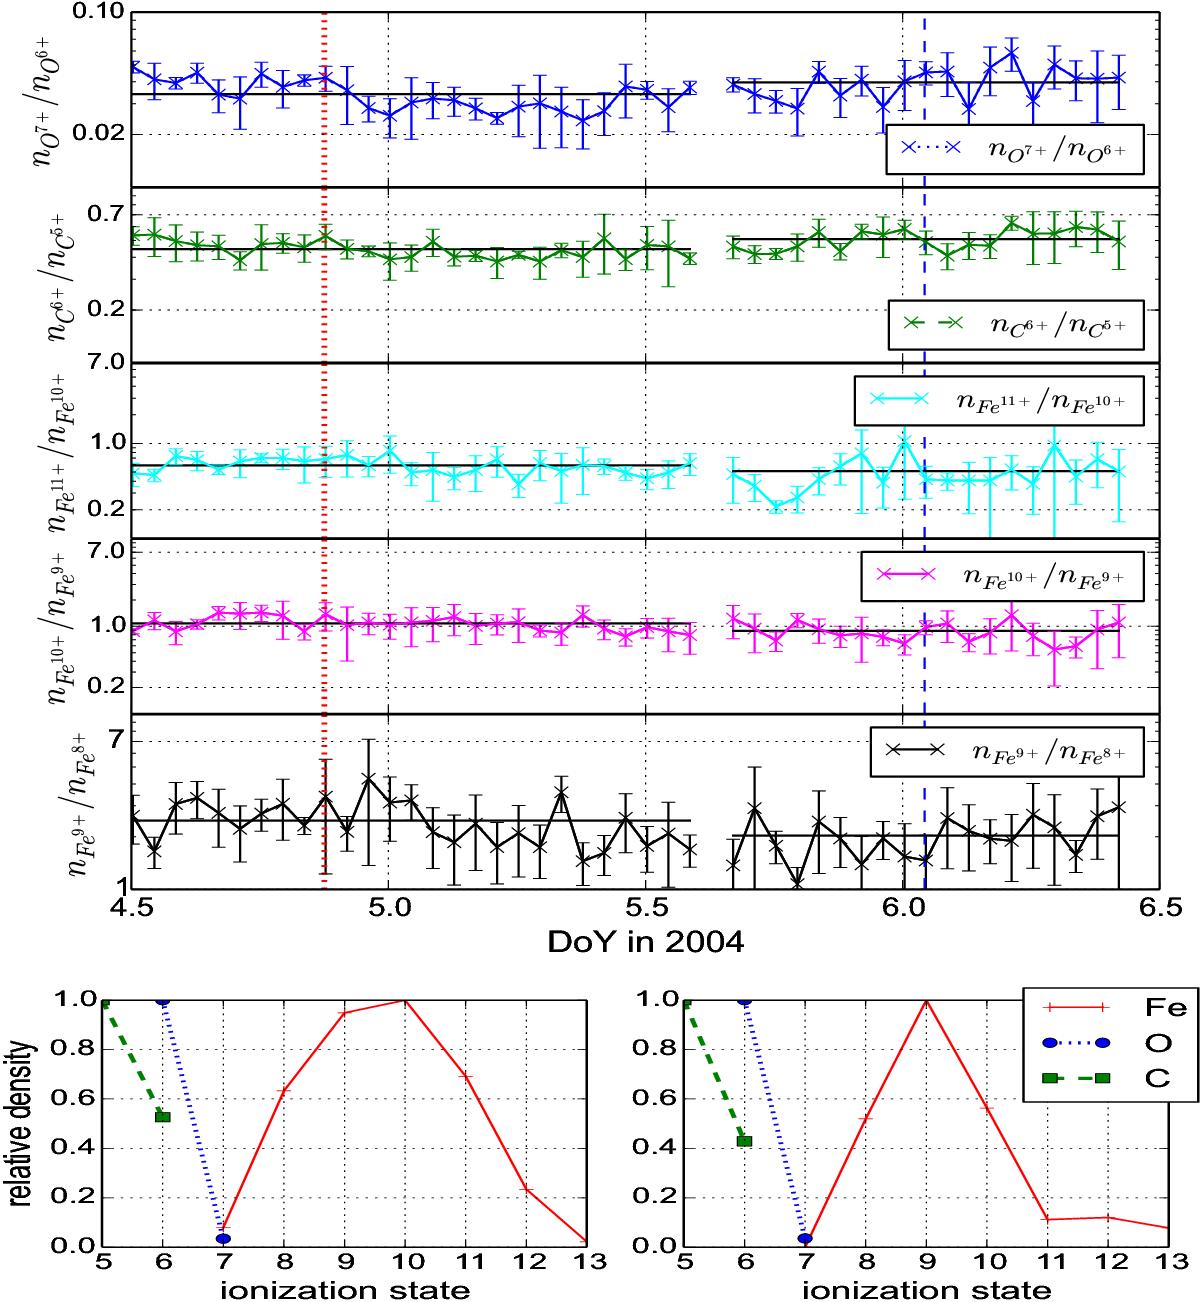
Ion density ratios for the highlighted part of the coronal-hole-wind stream from Fig. 2. The five top panels show the density ratios of ion pairs, namely nO7 +/nO6 +, nC6 +/nC5 +, nFe11 +/nFe10 +,nFe10 +/nFe9 +,nFe9 +/nFe8 +. Each curve is divided into two parts. This partition is based on the mean Fe charge-state as illustrated in Fig. 4. The horizontal lines in each panel give the mean density ratio in the left and right interval, respectively. The vertical lines in the five top panels indicate the points in times for which examples of charge-state distributions normalized to the maximum density for C, O, and Fe are shown in the bottom panel. The dotted line corresponds to the left bottom panel and the dashed line to the right panel.(Although C4 + is more abundant than C6 + it is omitted here because it tends to be contaminated with adjacent O ions in ACE/SWICS.) Each data point represents a one-hour average and the error bars reflect the error from the counting statistics.
Current usage metrics show cumulative count of Article Views (full-text article views including HTML views, PDF and ePub downloads, according to the available data) and Abstracts Views on Vision4Press platform.
Data correspond to usage on the plateform after 2015. The current usage metrics is available 48-96 hours after online publication and is updated daily on week days.
Initial download of the metrics may take a while.