Open Access
Fig. 1
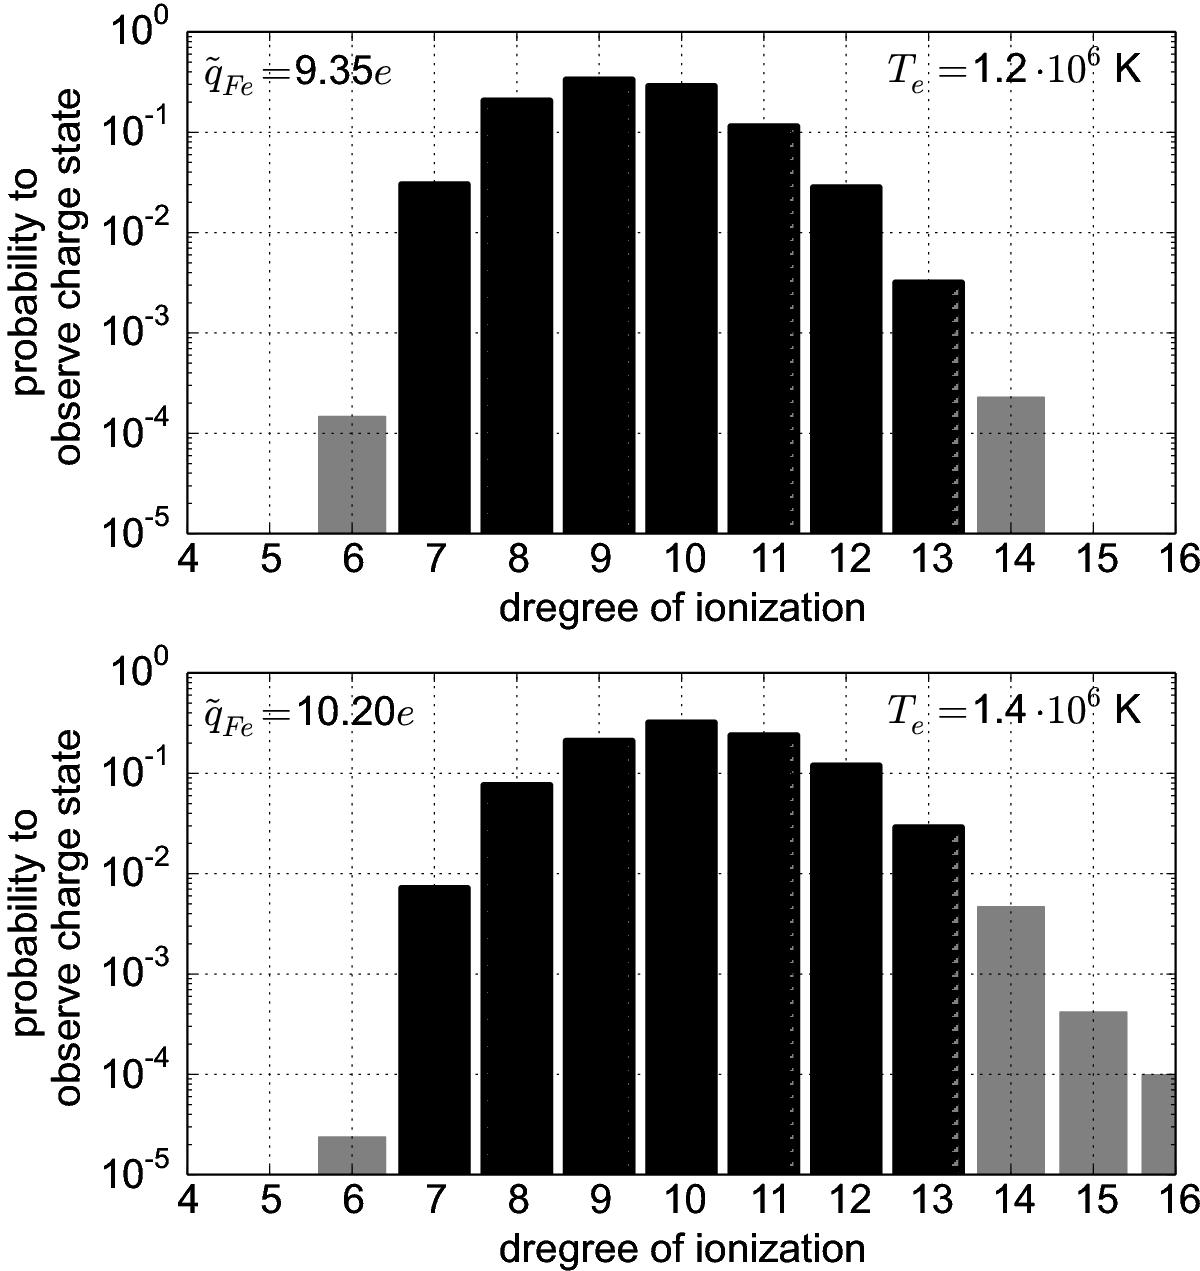
Top panel: Fe charge-state distribution at T = 1.2 × 10⁶ K taken from the CHIANTI database. Bottom panel: Fe charge-state distribution at T = 1.4 × 10⁶ K from the CHIANTI. The black borders indicate the Fe charge states considered in this work. In both panels, the mean Fe charge-state ![]() is given as inset on the left.
is given as inset on the left.
This figure is made of several images, please see below:
Current usage metrics show cumulative count of Article Views (full-text article views including HTML views, PDF and ePub downloads, according to the available data) and Abstracts Views on Vision4Press platform.
Data correspond to usage on the plateform after 2015. The current usage metrics is available 48-96 hours after online publication and is updated daily on week days.
Initial download of the metrics may take a while.