Fig. 10
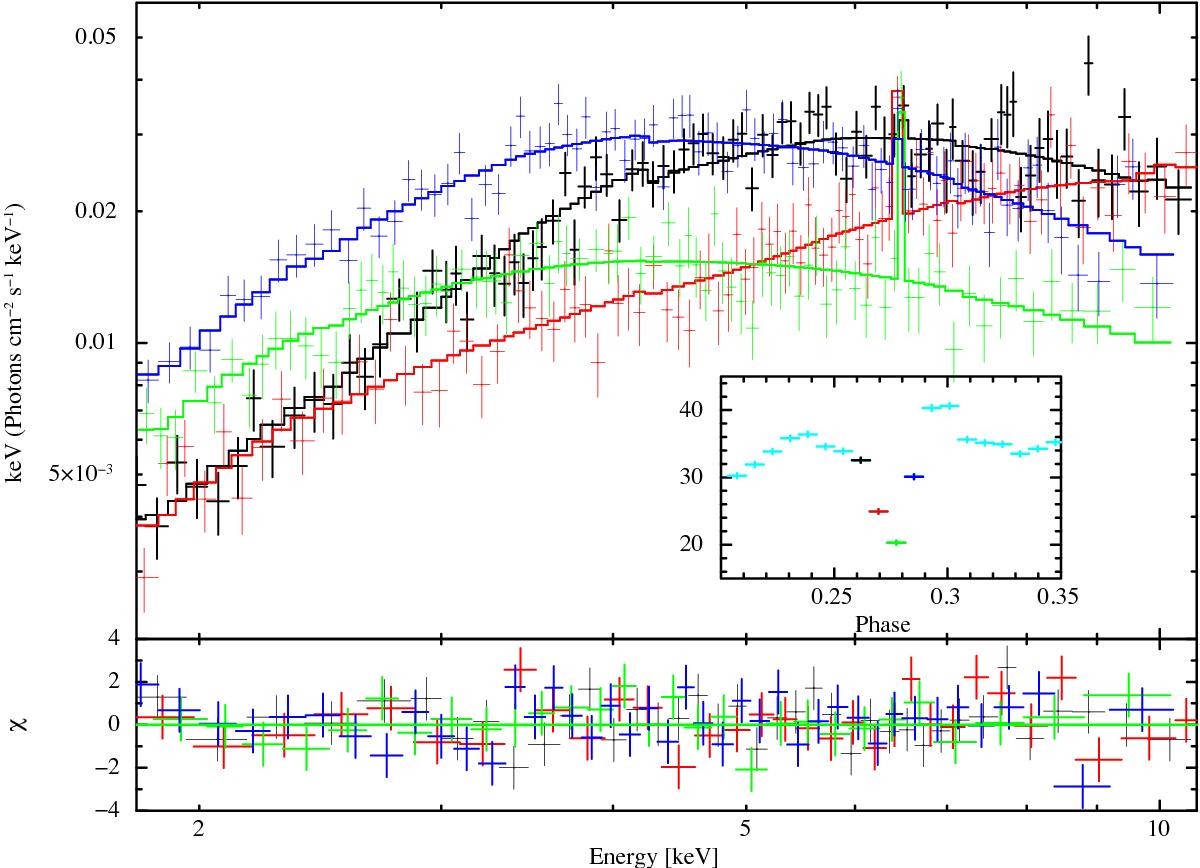
Upper panel: phase-resolved deconvolved energy spectra extracted from the XMM-Newton observation during the V-shaped feature analyzed in Sect. 5. The best-fit model for all spectra is the one described in Sect. 4. The different selected phases for which the spectra are extracted are represented with the same color in the zoomed pulse profile in the inset (cyan points represent the pulse profile data for which no spectrum is displayed). Only EPIC-pn data are shown for clarity. The lower panel shows the residuals from the fit.
Current usage metrics show cumulative count of Article Views (full-text article views including HTML views, PDF and ePub downloads, according to the available data) and Abstracts Views on Vision4Press platform.
Data correspond to usage on the plateform after 2015. The current usage metrics is available 48-96 hours after online publication and is updated daily on week days.
Initial download of the metrics may take a while.