Fig. 5
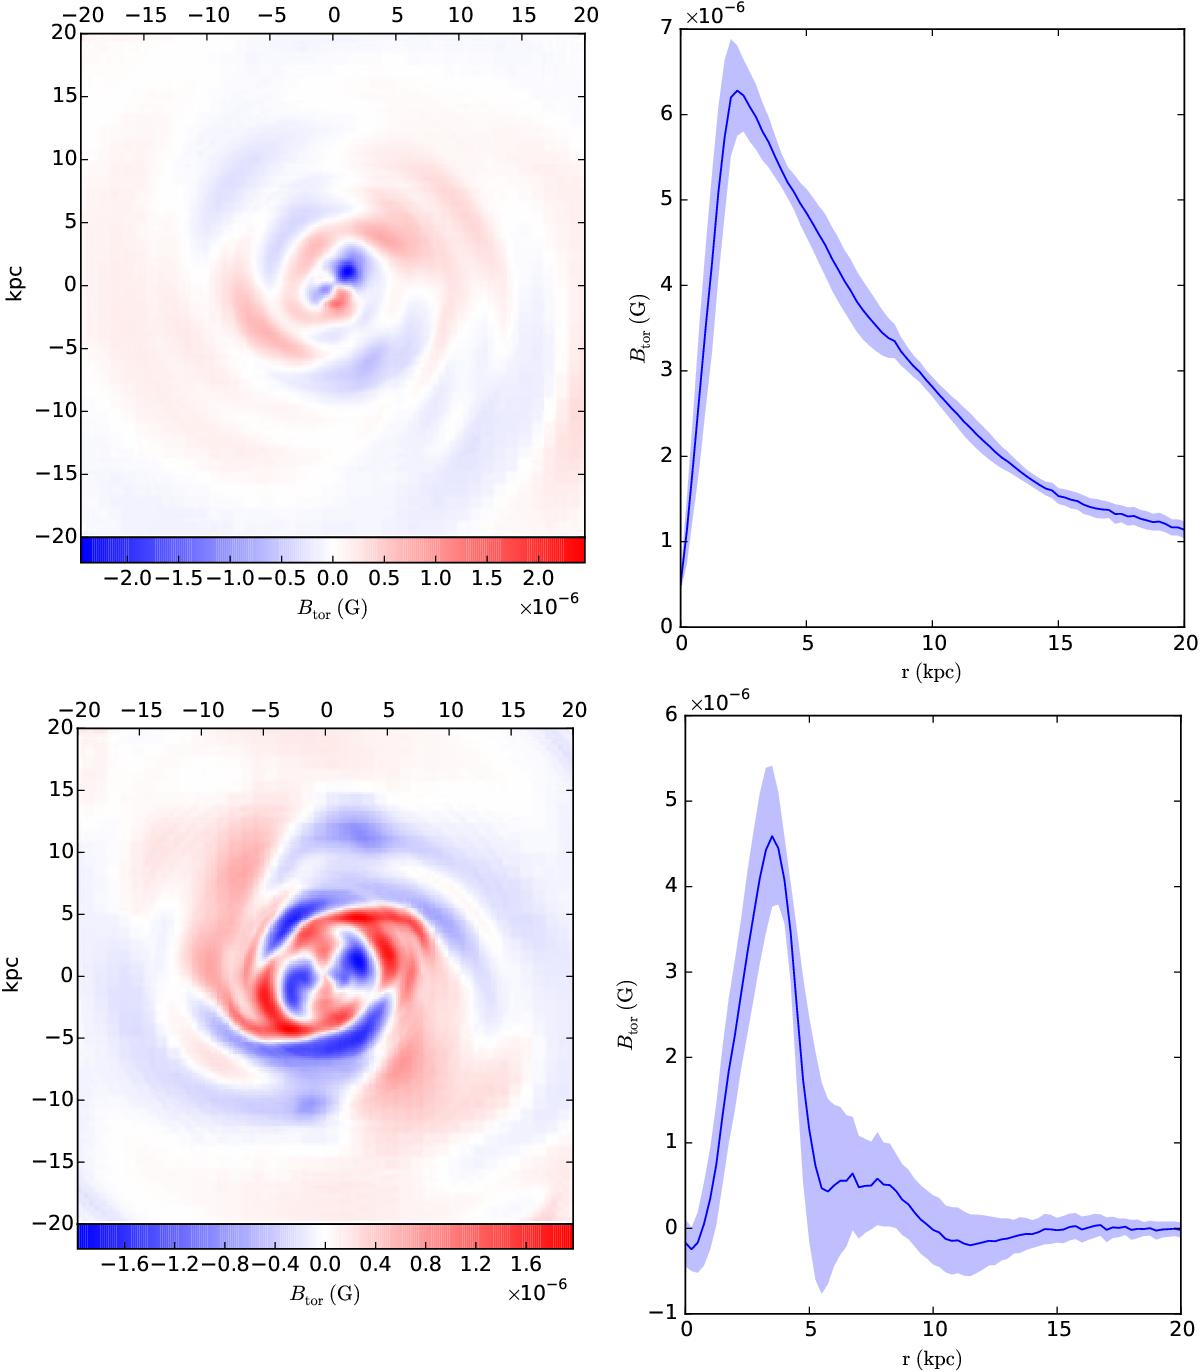
Magnetic field structure before the merger (at 3 Gyr) and after the merger (at 5 Gyr, i.e., about 0.6 Gyr after the merger of the core). Left: projection of the fluctuation of the toroidal magnetic field strength (local toroidal field minus mean toroidal field at the same radius) in the central 40 kpc. Right: radial profile of the toroidal magnetic field as a function of radius, including its rms distribution. Both plots refer to the reference run A.
Current usage metrics show cumulative count of Article Views (full-text article views including HTML views, PDF and ePub downloads, according to the available data) and Abstracts Views on Vision4Press platform.
Data correspond to usage on the plateform after 2015. The current usage metrics is available 48-96 hours after online publication and is updated daily on week days.
Initial download of the metrics may take a while.