Fig. 3
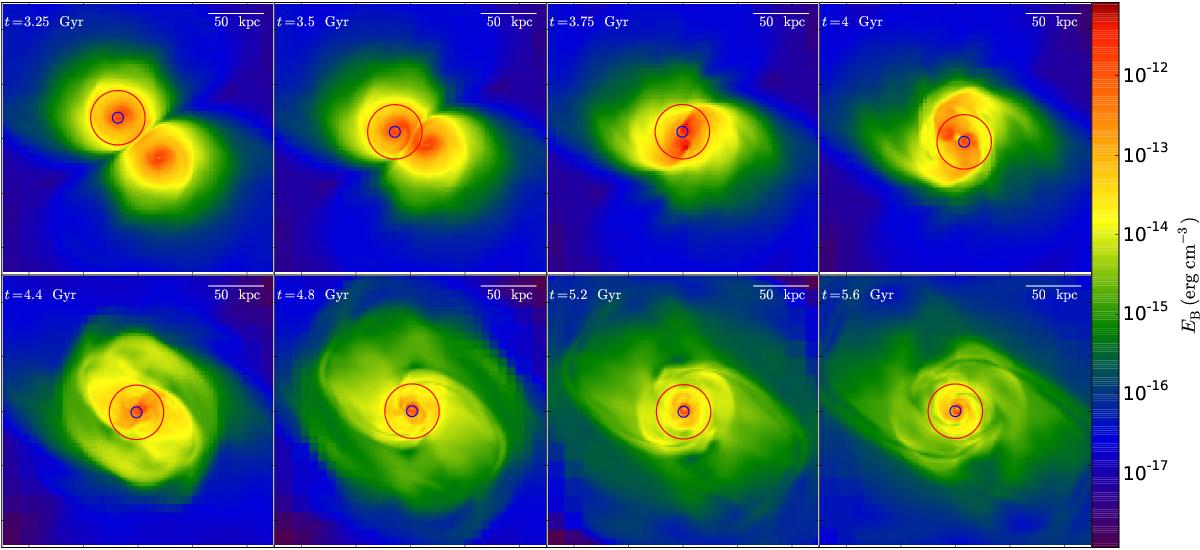
Density-weighted projections of the magnetic energy density between 3.25 Gyr and 5.6 Gyr, showing the evolution on scales of 250 kpc around the merger event (run A). The structure visible in the magnetic energy resembles the structure visible in the gas density. The galaxy cores have clearly merged after 4.4 Gyr. We indicate the region over which the field strength of the whole galaxy is averaged with circles (25 kpc), and also the region corresponding to an average over the center (5 kpc). The circles are centered on the density peak in the simulation.
Current usage metrics show cumulative count of Article Views (full-text article views including HTML views, PDF and ePub downloads, according to the available data) and Abstracts Views on Vision4Press platform.
Data correspond to usage on the plateform after 2015. The current usage metrics is available 48-96 hours after online publication and is updated daily on week days.
Initial download of the metrics may take a while.