Free Access
Fig. 1
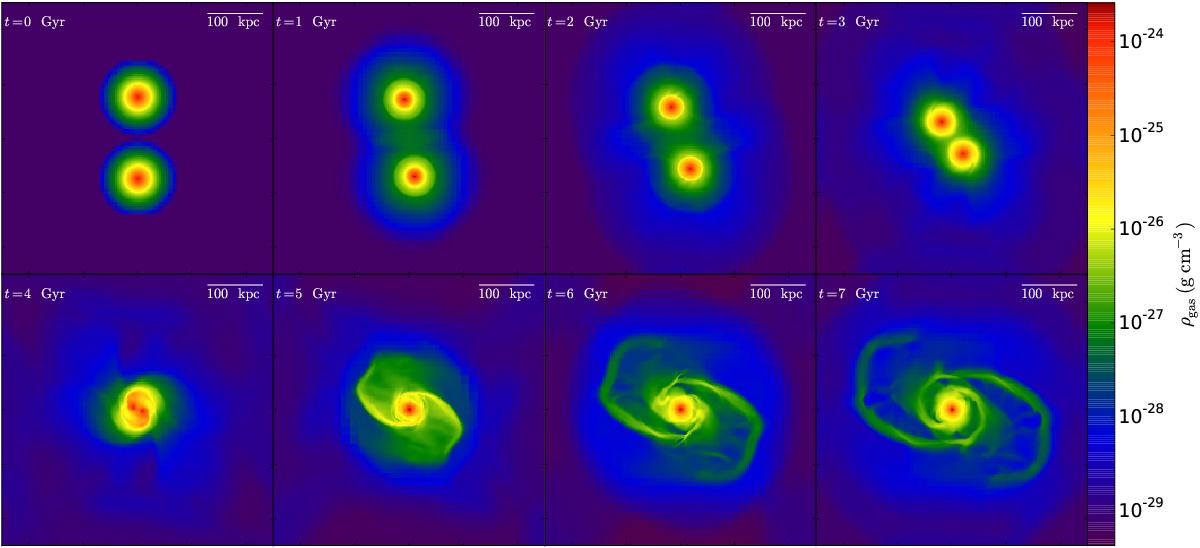
Density slice in the x − y plane at different times showing the global evolution in the simulation box (run A), including the merger stage at about 4 Gyr and the post-merger configuration after 5 Gyr.
Current usage metrics show cumulative count of Article Views (full-text article views including HTML views, PDF and ePub downloads, according to the available data) and Abstracts Views on Vision4Press platform.
Data correspond to usage on the plateform after 2015. The current usage metrics is available 48-96 hours after online publication and is updated daily on week days.
Initial download of the metrics may take a while.