Fig. 9
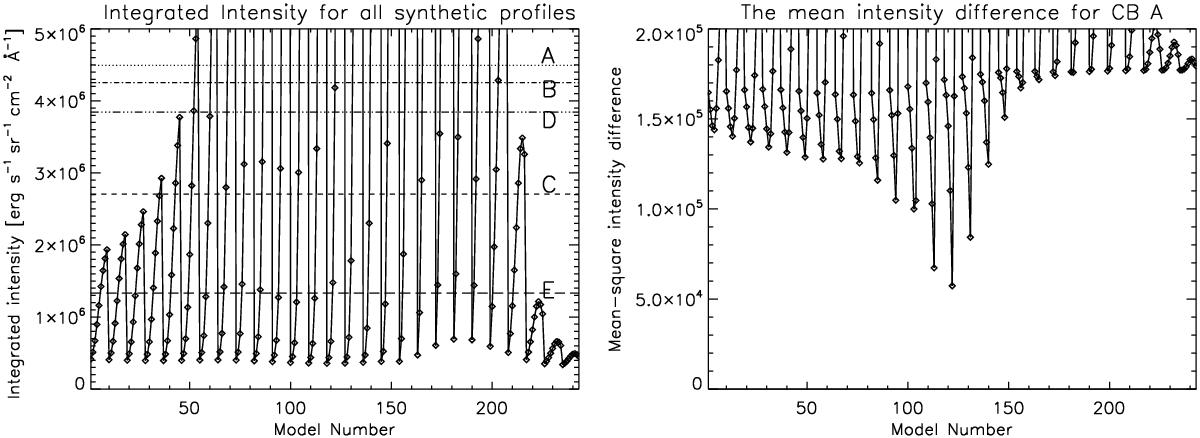
Left panel: example of one profile parameter, such as the right integrated intensity obtained for all models. The horizontal lines on the diagram represent the values of the parameter for the observed profiles − dotted line for A brightening, dashed line for B, dashed dotted line C, dashed-dotted-dotted-dotted for D and long dashed line for E. Right panel: the square root of the mean-square intensity difference between synthetic and observed profiles: one example of the A brightening. The best model for A is N = 120.
Current usage metrics show cumulative count of Article Views (full-text article views including HTML views, PDF and ePub downloads, according to the available data) and Abstracts Views on Vision4Press platform.
Data correspond to usage on the plateform after 2015. The current usage metrics is available 48-96 hours after online publication and is updated daily on week days.
Initial download of the metrics may take a while.