Fig. 7
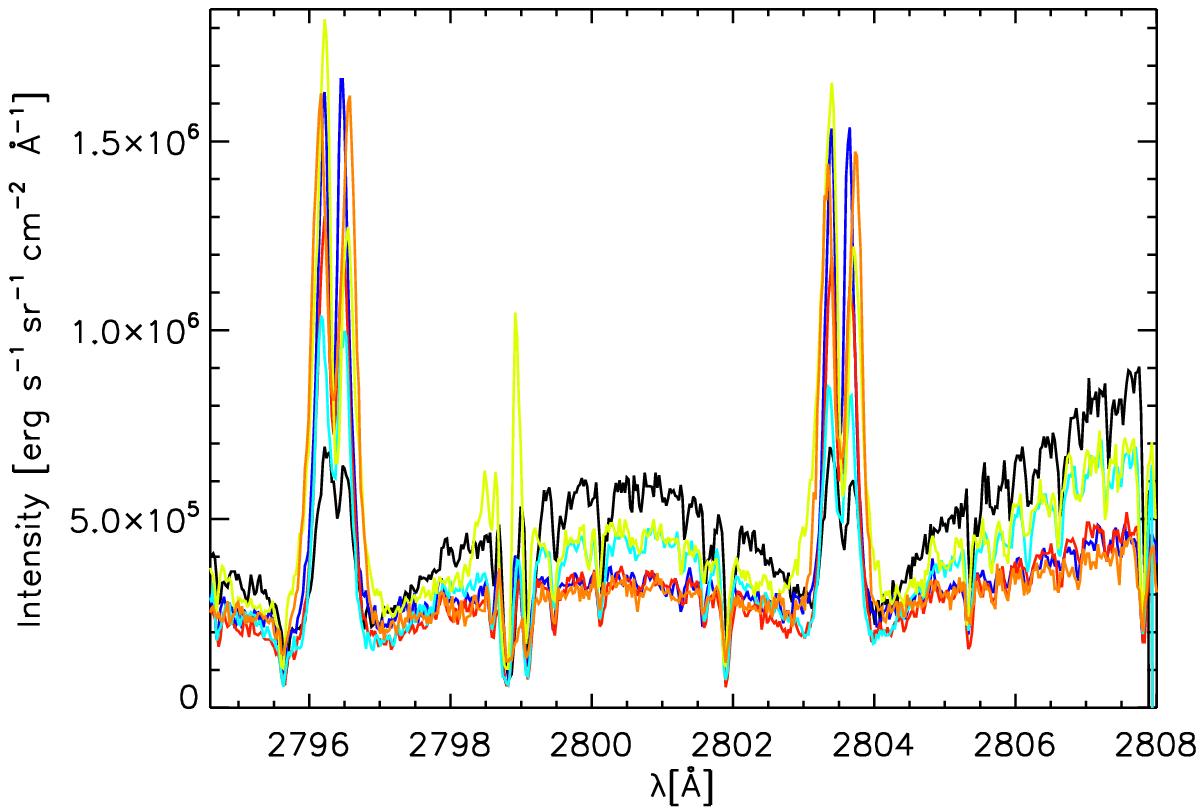
Intensity profiles of Mg II lines for events that have high intensity in the wings and small intensity in the peaks. The selection was done randomly (see the small circles in Fig. 3). The correspondence is as follows: 5 − dark blue; 6 − light blue; 7 − red; 8 − orange; 9 − light green. The black line represents the E profile. All these profiles have a shape between CB C and CB E profiles.
Current usage metrics show cumulative count of Article Views (full-text article views including HTML views, PDF and ePub downloads, according to the available data) and Abstracts Views on Vision4Press platform.
Data correspond to usage on the plateform after 2015. The current usage metrics is available 48-96 hours after online publication and is updated daily on week days.
Initial download of the metrics may take a while.