Fig. 5
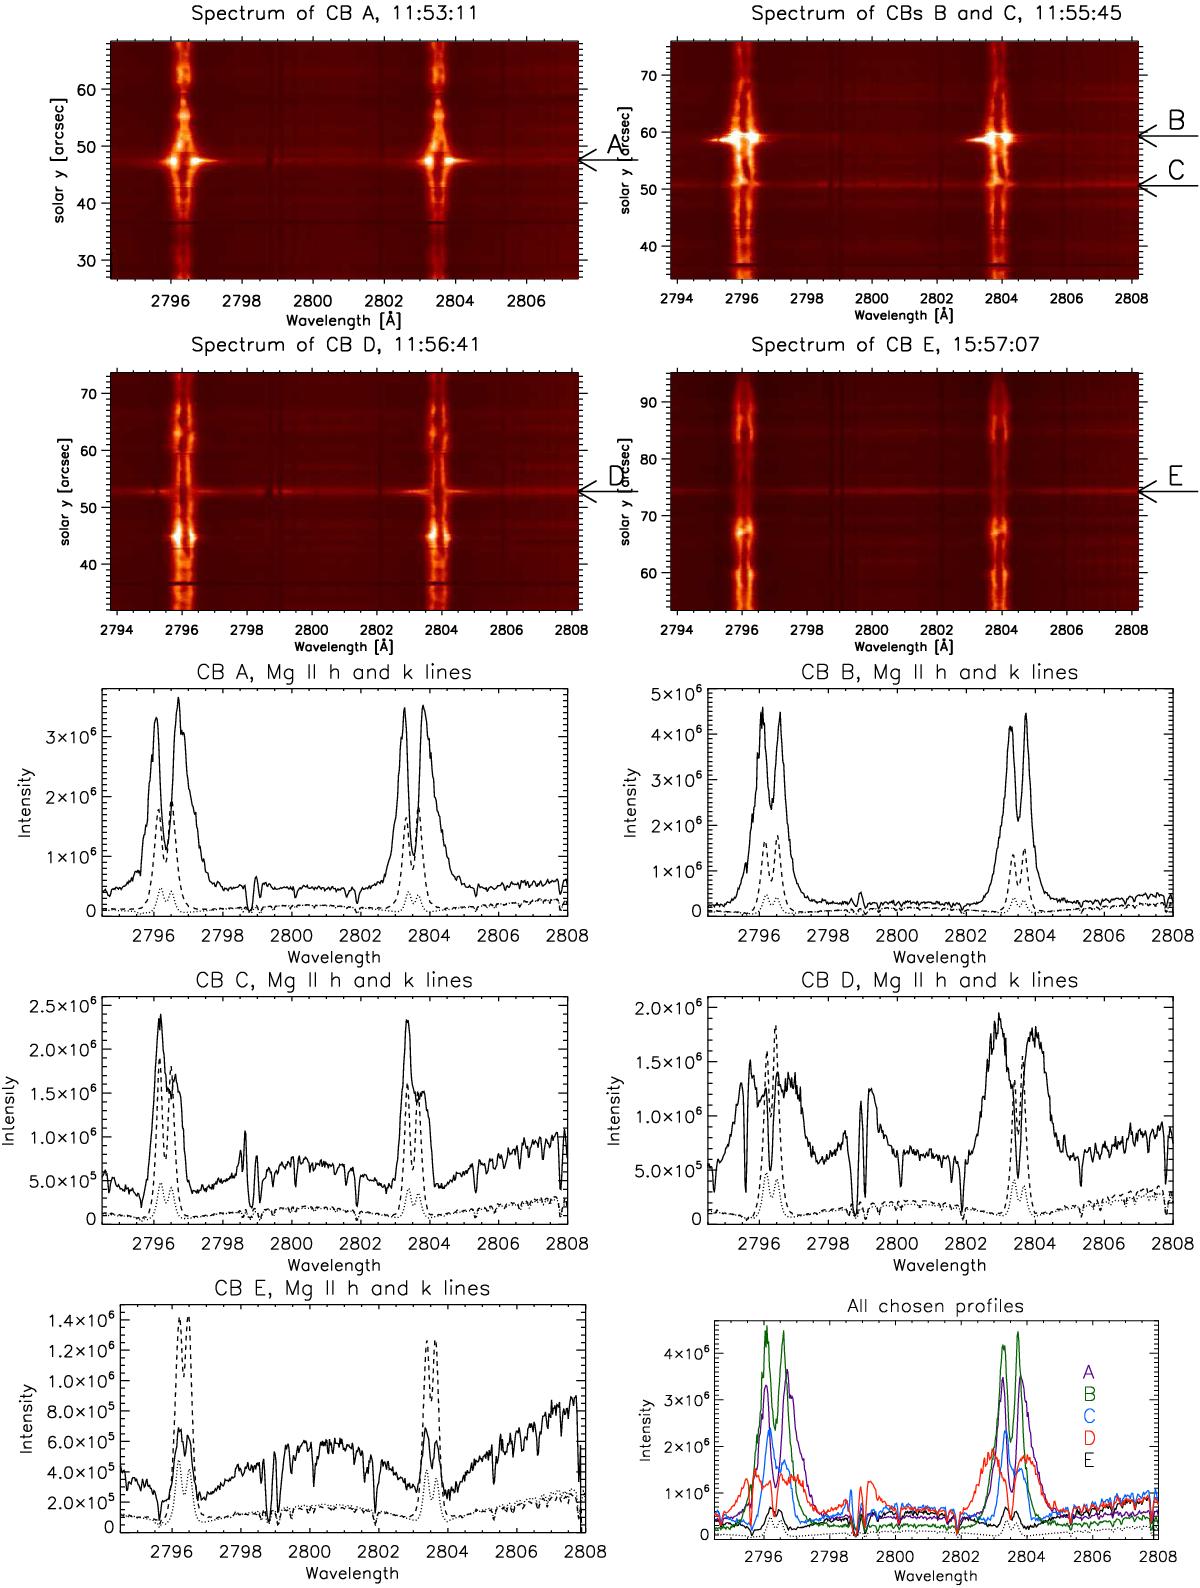
Spectra and profiles of Mg II h and k and Mg II triplet at 2798.7 Å lines for the five selected CBs. Two top rows: spectra of the CBs shown in the boxes of Figs. 3 and 4. The arrows indicate the positions of each CB: A to E at y = 47.5, 59.0, 50.9, 52.7, 74.2 arcsec, respectively, where the profiles are taken and drawn below. Bottom five plots: profiles of A to E (solid line) with the QS (dotted line) and the nearby quiet profile (dashed thin line). Bottom right panel: plot of all the selected profiles shown in a different colour: A − purple; B − green; C − blue; D − red; and E − black. Intensity units is (erg s-1 cm -2Å-1sr-1), wavelengths unit is Å. For CBs C and D, we note that the emission of Mg II triplet is enhanced and its line profile is absorbed by an Mg II line (2798.6 Å) in the blue wing and by an Mn I line (2799.2 Å) in the red wing.
Current usage metrics show cumulative count of Article Views (full-text article views including HTML views, PDF and ePub downloads, according to the available data) and Abstracts Views on Vision4Press platform.
Data correspond to usage on the plateform after 2015. The current usage metrics is available 48-96 hours after online publication and is updated daily on week days.
Initial download of the metrics may take a while.