Fig. 4
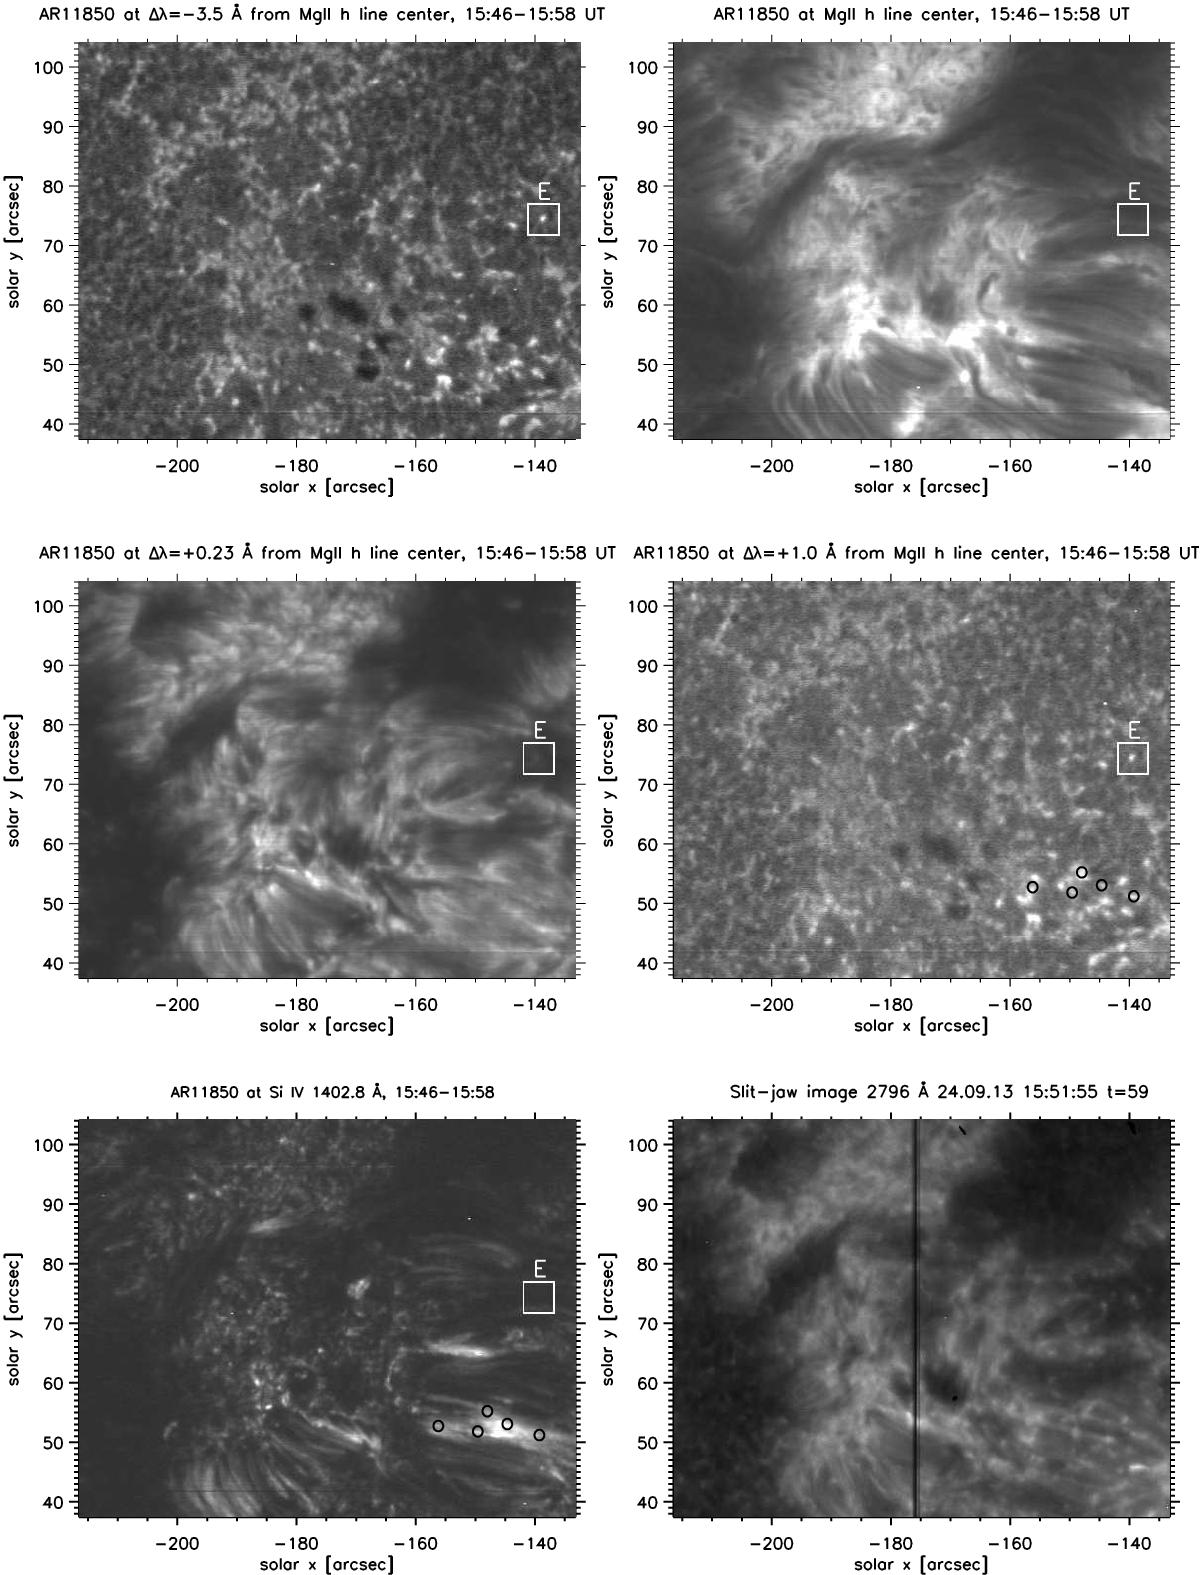
AR 11850 IRIS observations of raster 2 (the field of view is indicated in Fig. 1, right panel). Top and middle panels from left to right: Mg II spectroheliograms at 2800.0 Å, 2803.5 Å, 2803.7 Å, and 2804.5 Å. Bottom left panel: spectroheliogram in Si IV line. Black circles in Mg II +0.1 Å and in Si IV spectroheliogram indicate CBs visible in Si IV and Mg II line wing. Bottom right panel: slit-jaw image at 2796 Å. The white box indicates the location of the CB (E) that we have analysed. The EB (E) is not visible in Si IV and Mg II core of the line.
Current usage metrics show cumulative count of Article Views (full-text article views including HTML views, PDF and ePub downloads, according to the available data) and Abstracts Views on Vision4Press platform.
Data correspond to usage on the plateform after 2015. The current usage metrics is available 48-96 hours after online publication and is updated daily on week days.
Initial download of the metrics may take a while.