Fig. 3
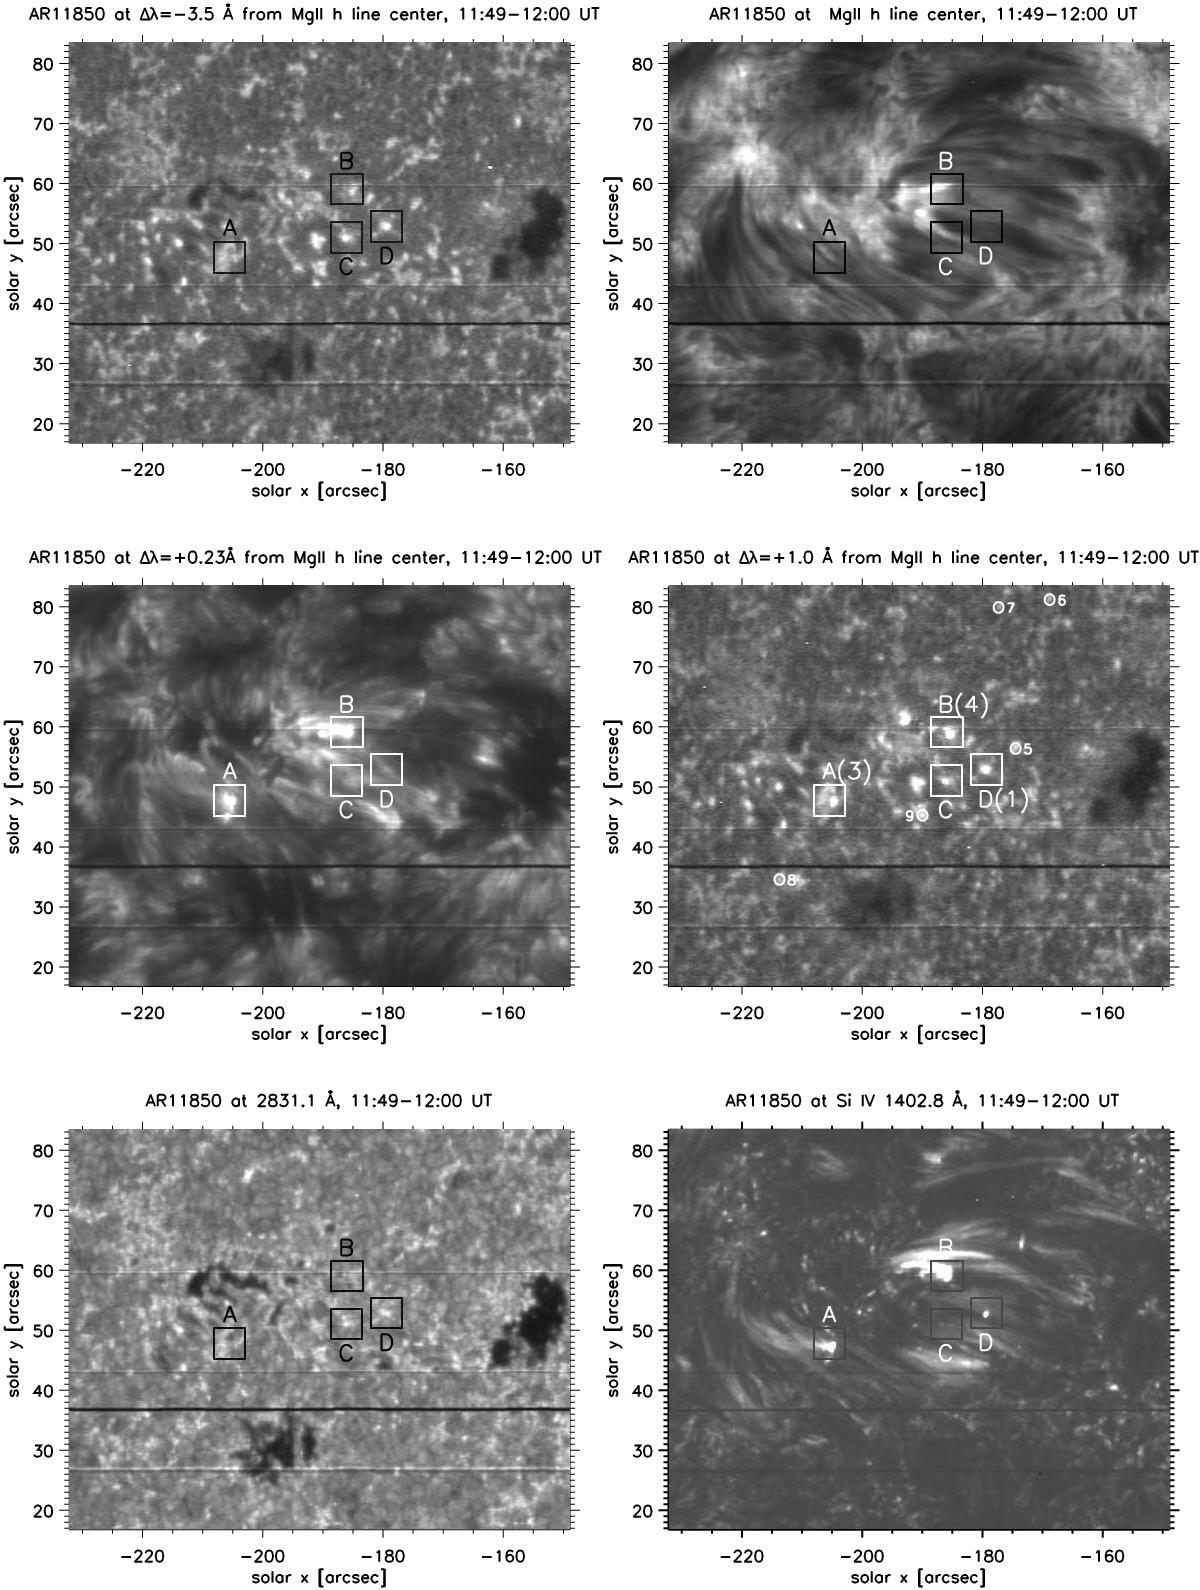
AR 11850 IRIS observations of raster 1 (the field of view is indicated in Fig. 1, right panel). Top and middle panels from left to right: Mg II spectroheliograms at 2800.0 Å, 2803.5 Å, 2803.7 Å and 2804.5 Å. Bottom left panel: spectroheliogram in the continuum at 2831.1 Å. Bottom right panel: spectroheliogram in Si V line. White or dark boxes show the selected CBs from A to D (the numbers in parenthesis indicate the hot explosions of Peter et al. 2014), small white circles with numbers 5 to 9 in the second row, right panel are examples of small brightenings.
Current usage metrics show cumulative count of Article Views (full-text article views including HTML views, PDF and ePub downloads, according to the available data) and Abstracts Views on Vision4Press platform.
Data correspond to usage on the plateform after 2015. The current usage metrics is available 48-96 hours after online publication and is updated daily on week days.
Initial download of the metrics may take a while.