Fig. 2
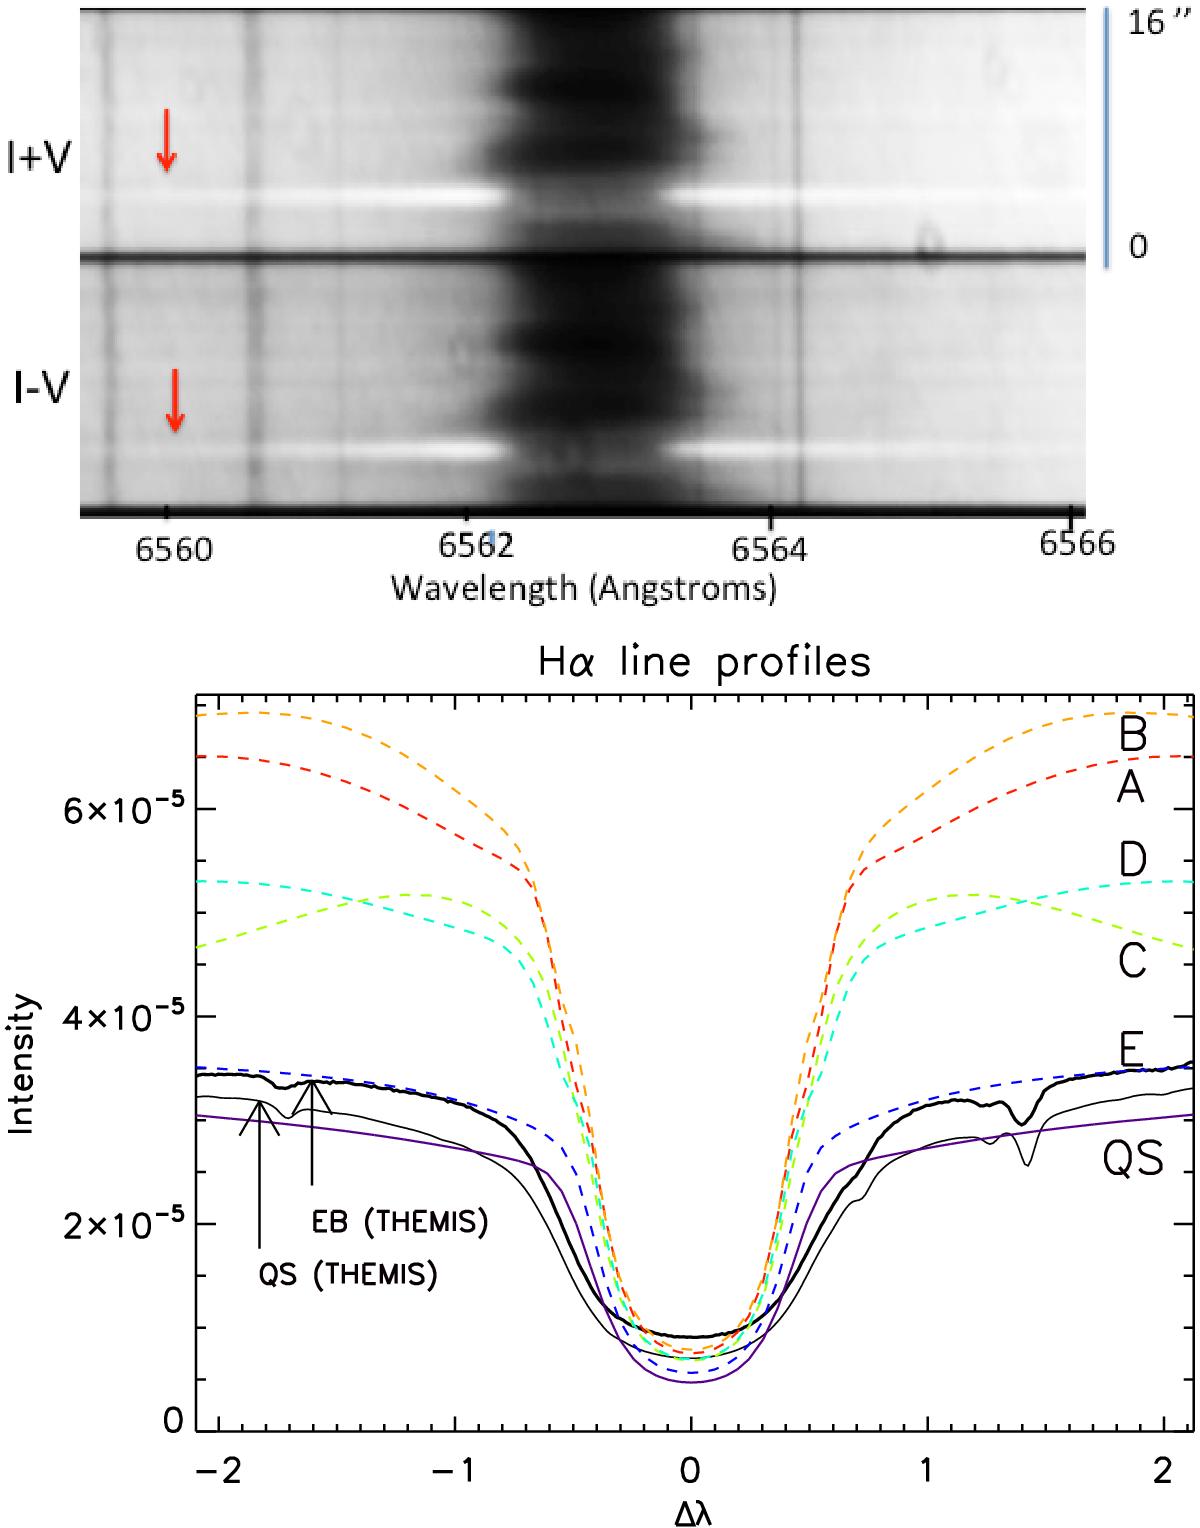
Top panel: spectrum of an EB in H α line observed by THEMIS/MTR spectropolarimeter. The two red arrows indicate the EB in I+V and I-V channels. Bottom panel: Hα profiles – Observed profiles: EB profile of the THEMIS spectrum shown in the top panel (solid black line), observed nearby quiet Sun profile from THEMIS (thin black line). Synthetic profiles computed from NLTE modelling: QS (purple solid line). All colour profiles described with letters from A to E are calculated for each best model of selected CBs (A − red; B − orange; C − light green; D − light blue; E − dark blue). Intensity units is (erg s-1 cm -2 Å-1sr-1), Δλ unit is Å.
Current usage metrics show cumulative count of Article Views (full-text article views including HTML views, PDF and ePub downloads, according to the available data) and Abstracts Views on Vision4Press platform.
Data correspond to usage on the plateform after 2015. The current usage metrics is available 48-96 hours after online publication and is updated daily on week days.
Initial download of the metrics may take a while.