Fig. 9
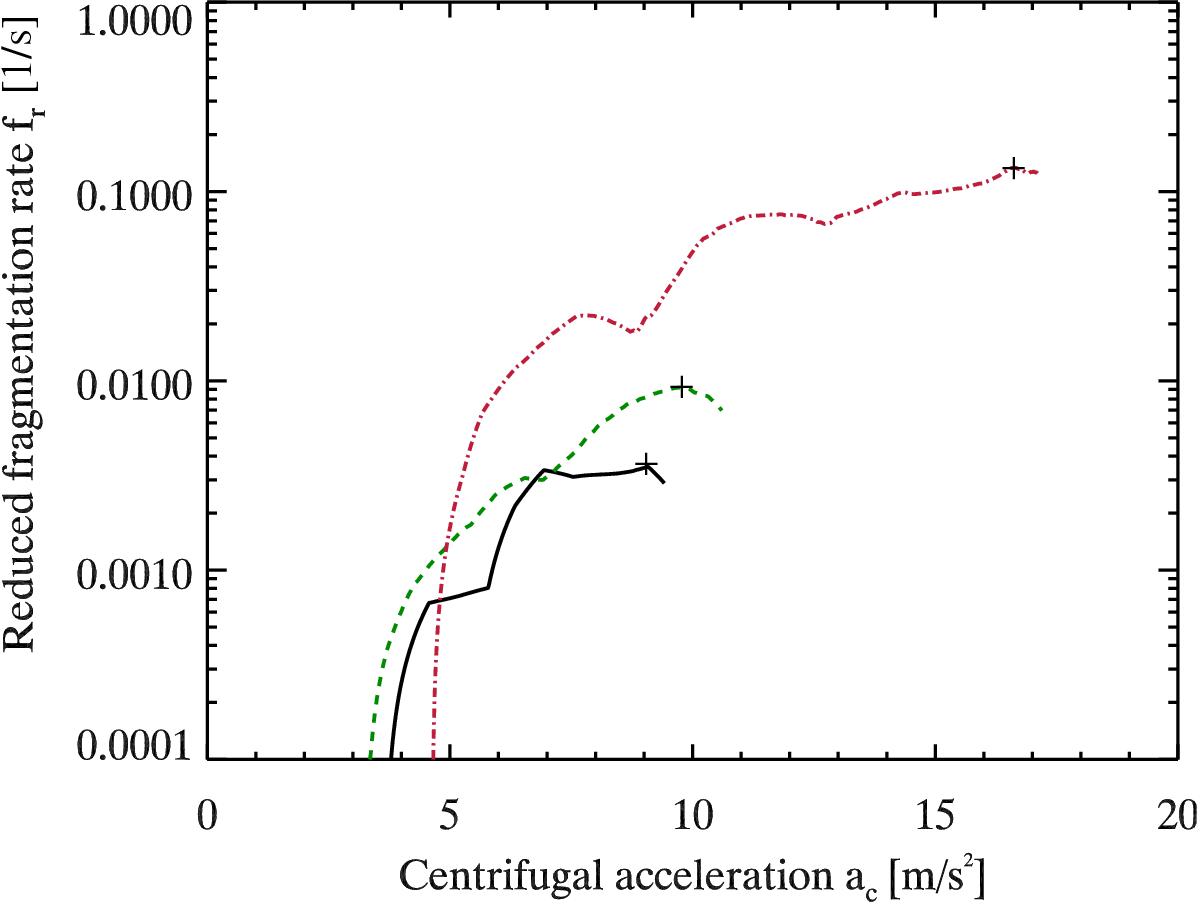
Normalized fragmentation rate of the clusters on the cell walls during the fragmentation phase of the second shaking cycle for the smaller and larger size distributions of aggregates composed of monodisperse SiO2 (red dash-dotted for small aggregates and green dashed line for large aggregates, respectively) and the larger size distribution of aggregates composed of polydisperse SiO2 (black solid line), plotted as a function of the centrifugal acceleration induced on the aggregates by the rotation of the cell wall. The curves are terminated at the acceleration where they reach the saturation of free-flying aggregates in the cell volume. The fragmentation rate maxima are shown by plus signs.
Current usage metrics show cumulative count of Article Views (full-text article views including HTML views, PDF and ePub downloads, according to the available data) and Abstracts Views on Vision4Press platform.
Data correspond to usage on the plateform after 2015. The current usage metrics is available 48-96 hours after online publication and is updated daily on week days.
Initial download of the metrics may take a while.