Fig. 7
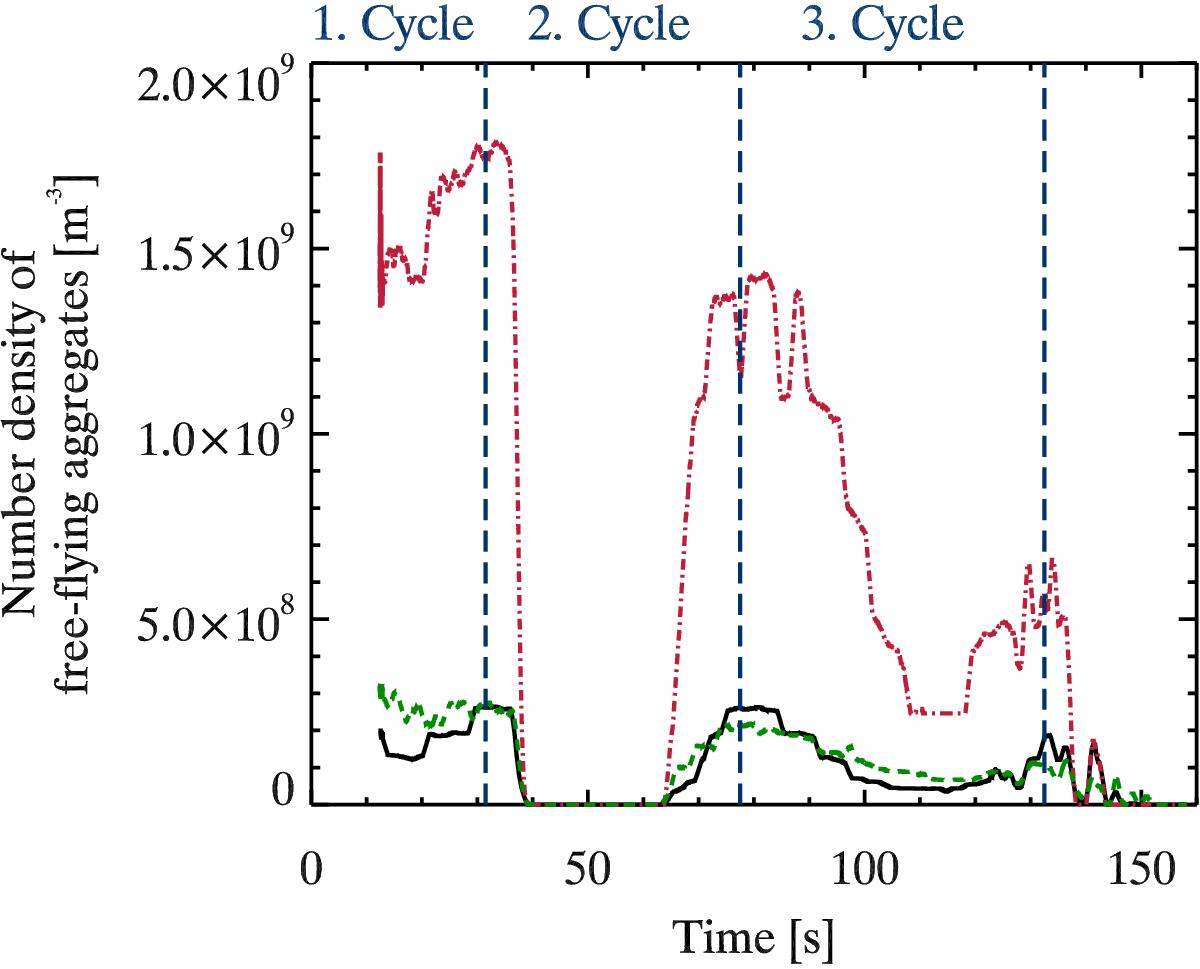
Retrieved number density of free-flying aggregates in the three cells of the SPACE experiment. The size distributions of large aggregates composed of polydisperse and monodisperse dust are shown as black solid and green dashed curves, respectively. The size distribution of small aggregates composed of monodisperse dust is shown as the red dash-dotted curve. The origin of time is at the start of data recording. The shaking cycles are indicated by dashed lines.
Current usage metrics show cumulative count of Article Views (full-text article views including HTML views, PDF and ePub downloads, according to the available data) and Abstracts Views on Vision4Press platform.
Data correspond to usage on the plateform after 2015. The current usage metrics is available 48-96 hours after online publication and is updated daily on week days.
Initial download of the metrics may take a while.