Fig. 5
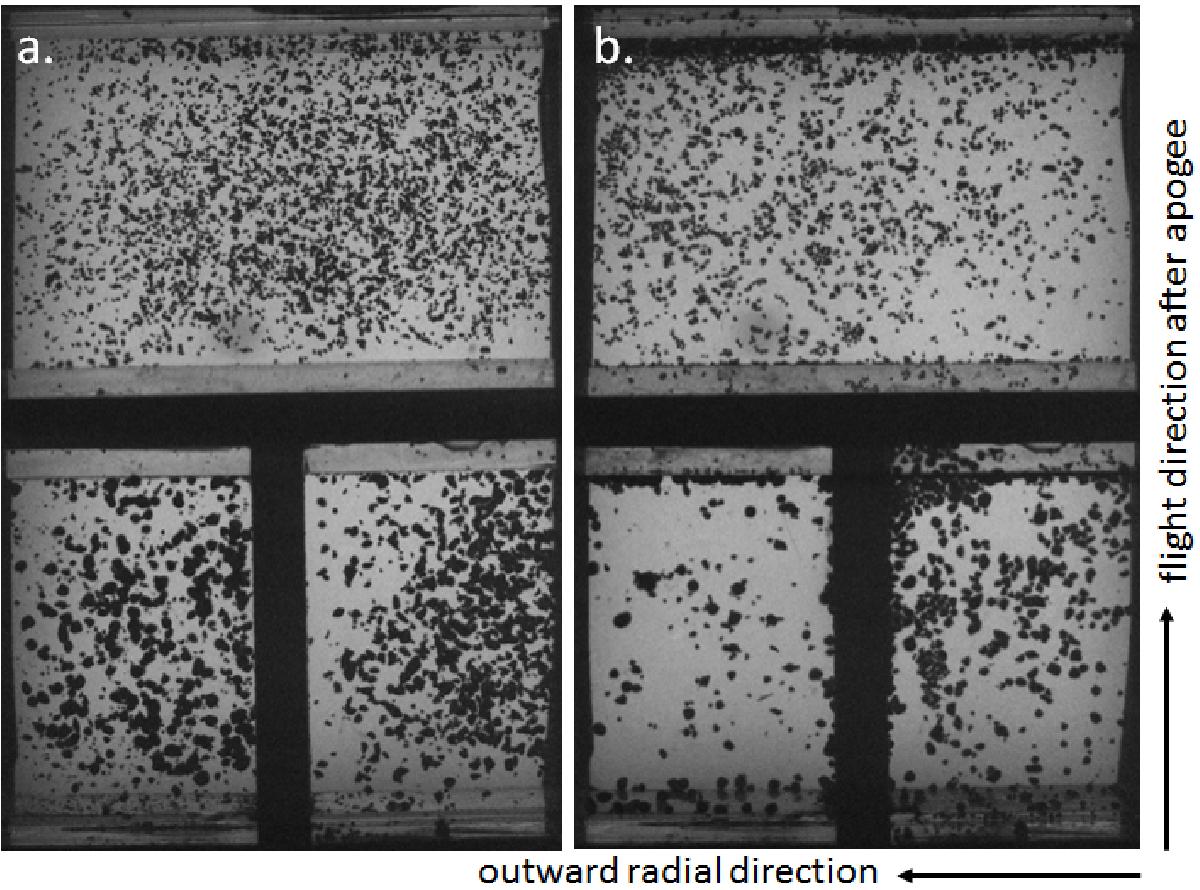
Two image frames recorded during the SPACE experiment. a) At the very beginning of the experimental run, when all the dust aggregates were free-flying. b) During a slow shaking phase of the experiment (see Fig. 2). In slow shaking phases, the preferential accumulation of aggregates in the cells’ left upper corner due to microgravity disturbances (see C.1 for details) is visible. The flight direction of the rocket (i.e. direction of gas drag) and the outward radial direction (i.e. direction of centrifugal force) are indicated.
Current usage metrics show cumulative count of Article Views (full-text article views including HTML views, PDF and ePub downloads, according to the available data) and Abstracts Views on Vision4Press platform.
Data correspond to usage on the plateform after 2015. The current usage metrics is available 48-96 hours after online publication and is updated daily on week days.
Initial download of the metrics may take a while.