Fig. A.3
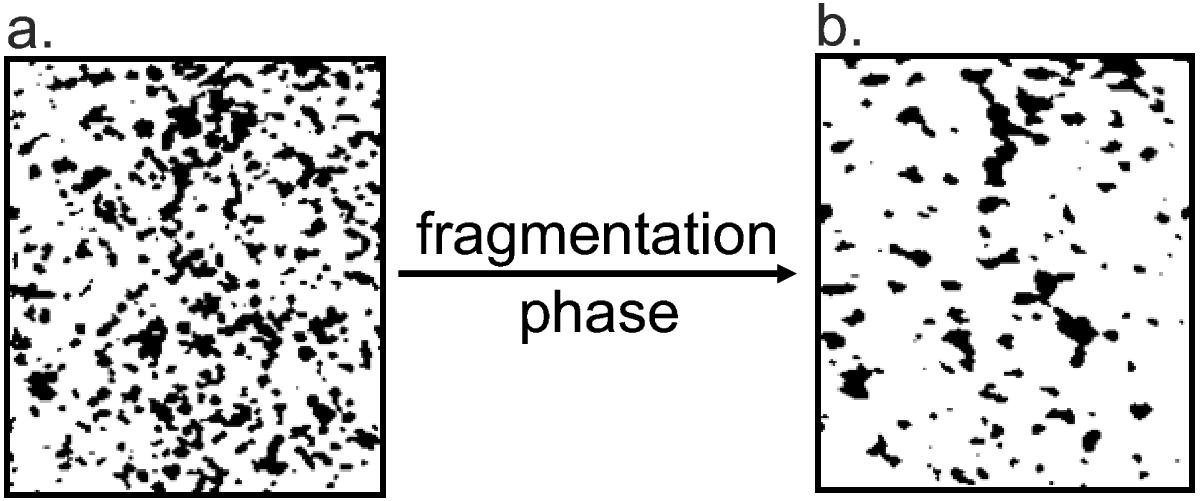
Analysis of the clusters on the cell walls inside the SPACE experiment during the suborbital flight. a) Region of interest inside an averaged and binarized data frame of the bigger experiment cell at the beginning of a fragmentation phase (61.8 s after beginning of the recording). b) Region of interest inside an averaged and binarized data frame of the same cell at the end of this fragmentation phase (76.5 s after beginning of the recording). The area covered by clusters (black areas) has visibly decreased.
Current usage metrics show cumulative count of Article Views (full-text article views including HTML views, PDF and ePub downloads, according to the available data) and Abstracts Views on Vision4Press platform.
Data correspond to usage on the plateform after 2015. The current usage metrics is available 48-96 hours after online publication and is updated daily on week days.
Initial download of the metrics may take a while.