Fig. A.2
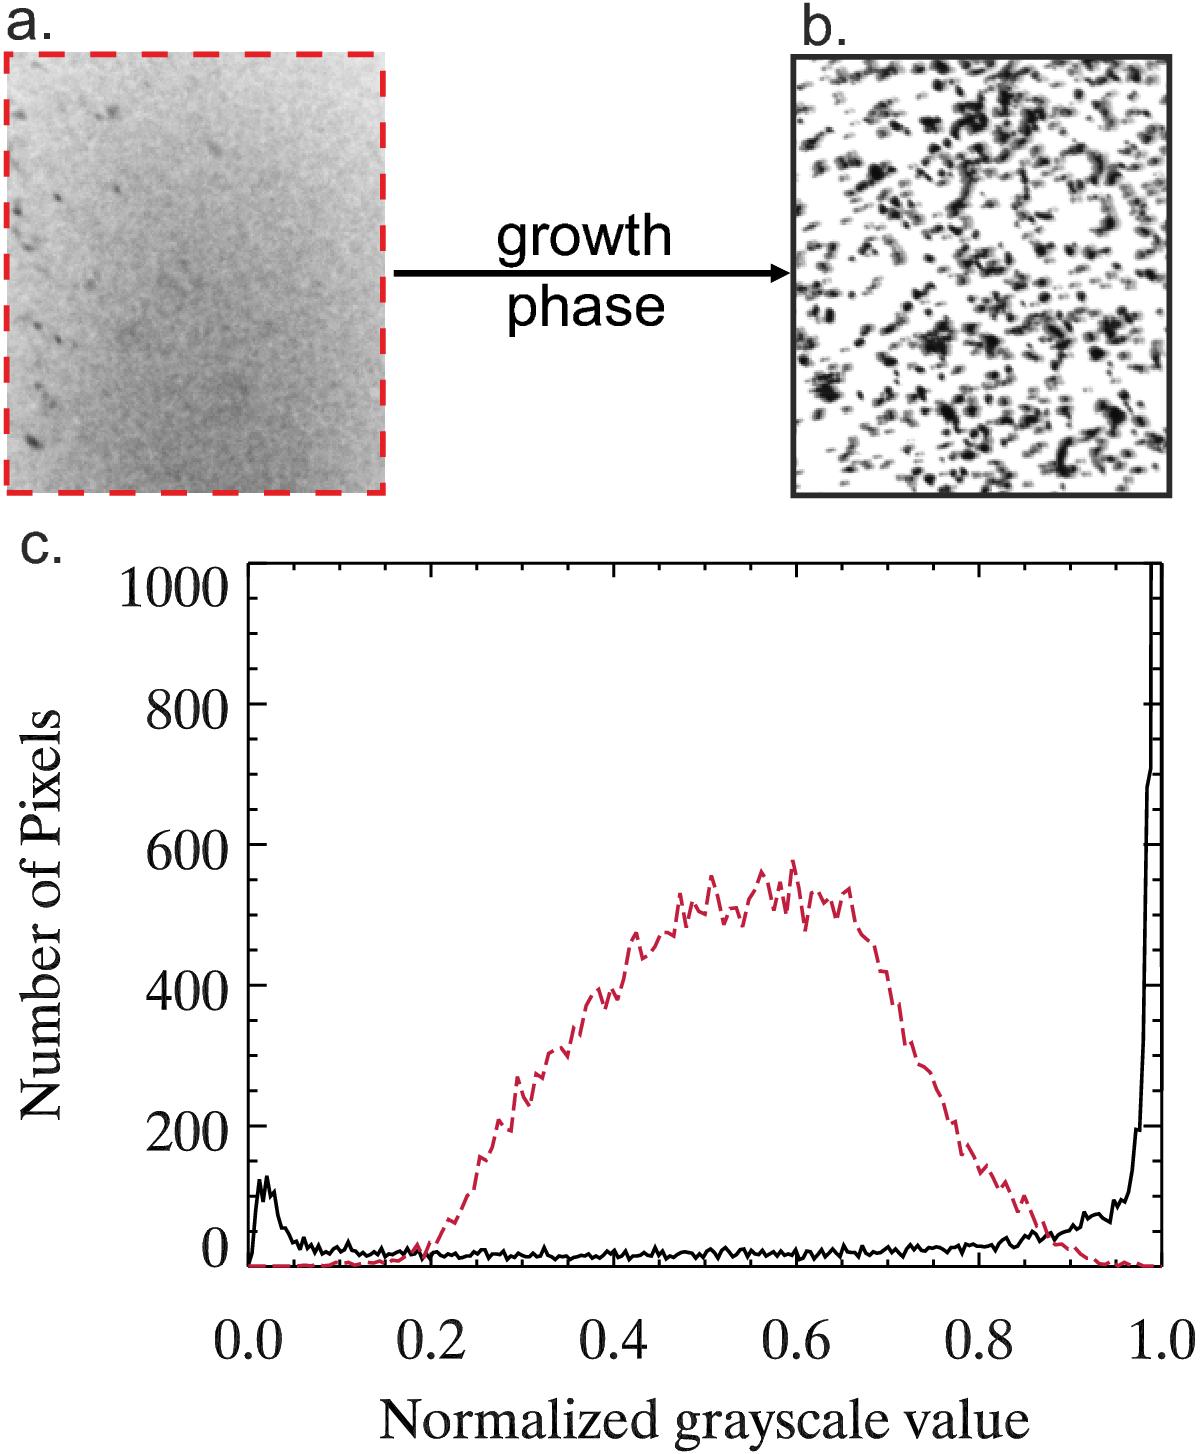
Analysis method used on the SPACE experiment data to determine the number of free-flying aggregates in the experiment cells at each moment in time. a) Region of interest inside an averaged data frame of the larger experiment cell (see Fig. 1b) at the beginning of the experiment run (1.2 s after start of recording), when all aggregates were free-flying. Image processing as shown in Fig. 7c was applied. b) Region of interest inside an averaged data frame of the same experiment cell during the slowest shaking phase (47.1 s after start of recording), when all aggregates are incorporated in clusters sticking to the glass walls. Image processing as shown in Fig. 7c was applied. c) greyscale histograms of frames a) and b) When all aggregates are free-flying a), the background is uniformly grey (dashed red line), whereas the dark clusters (small peak at lower greyscale values) and the bright background (high and narrow peak at higher greyscale values) can clearly be distinguished when the aggregates are all incorporated in clusters (solid black line).
Current usage metrics show cumulative count of Article Views (full-text article views including HTML views, PDF and ePub downloads, according to the available data) and Abstracts Views on Vision4Press platform.
Data correspond to usage on the plateform after 2015. The current usage metrics is available 48-96 hours after online publication and is updated daily on week days.
Initial download of the metrics may take a while.