Fig. A.1
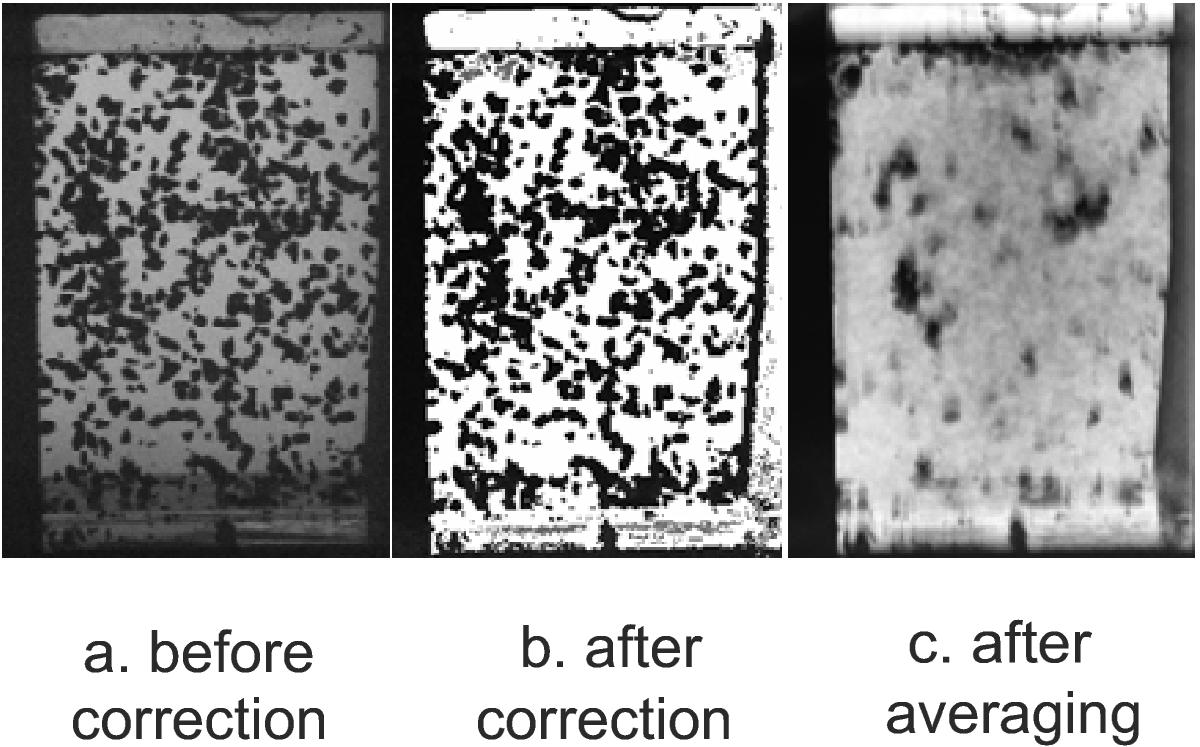
Image processing steps. a. Recorded SPACE data frame at 11.8 s after beginning of frame recording, showing one of the smaller experiment cells. b. The same frame after correction of background illumination. c. The same frame after background correction and averaging over 201 frames. The clusters on the cell walls become apparent.
Current usage metrics show cumulative count of Article Views (full-text article views including HTML views, PDF and ePub downloads, according to the available data) and Abstracts Views on Vision4Press platform.
Data correspond to usage on the plateform after 2015. The current usage metrics is available 48-96 hours after online publication and is updated daily on week days.
Initial download of the metrics may take a while.