Fig. 16
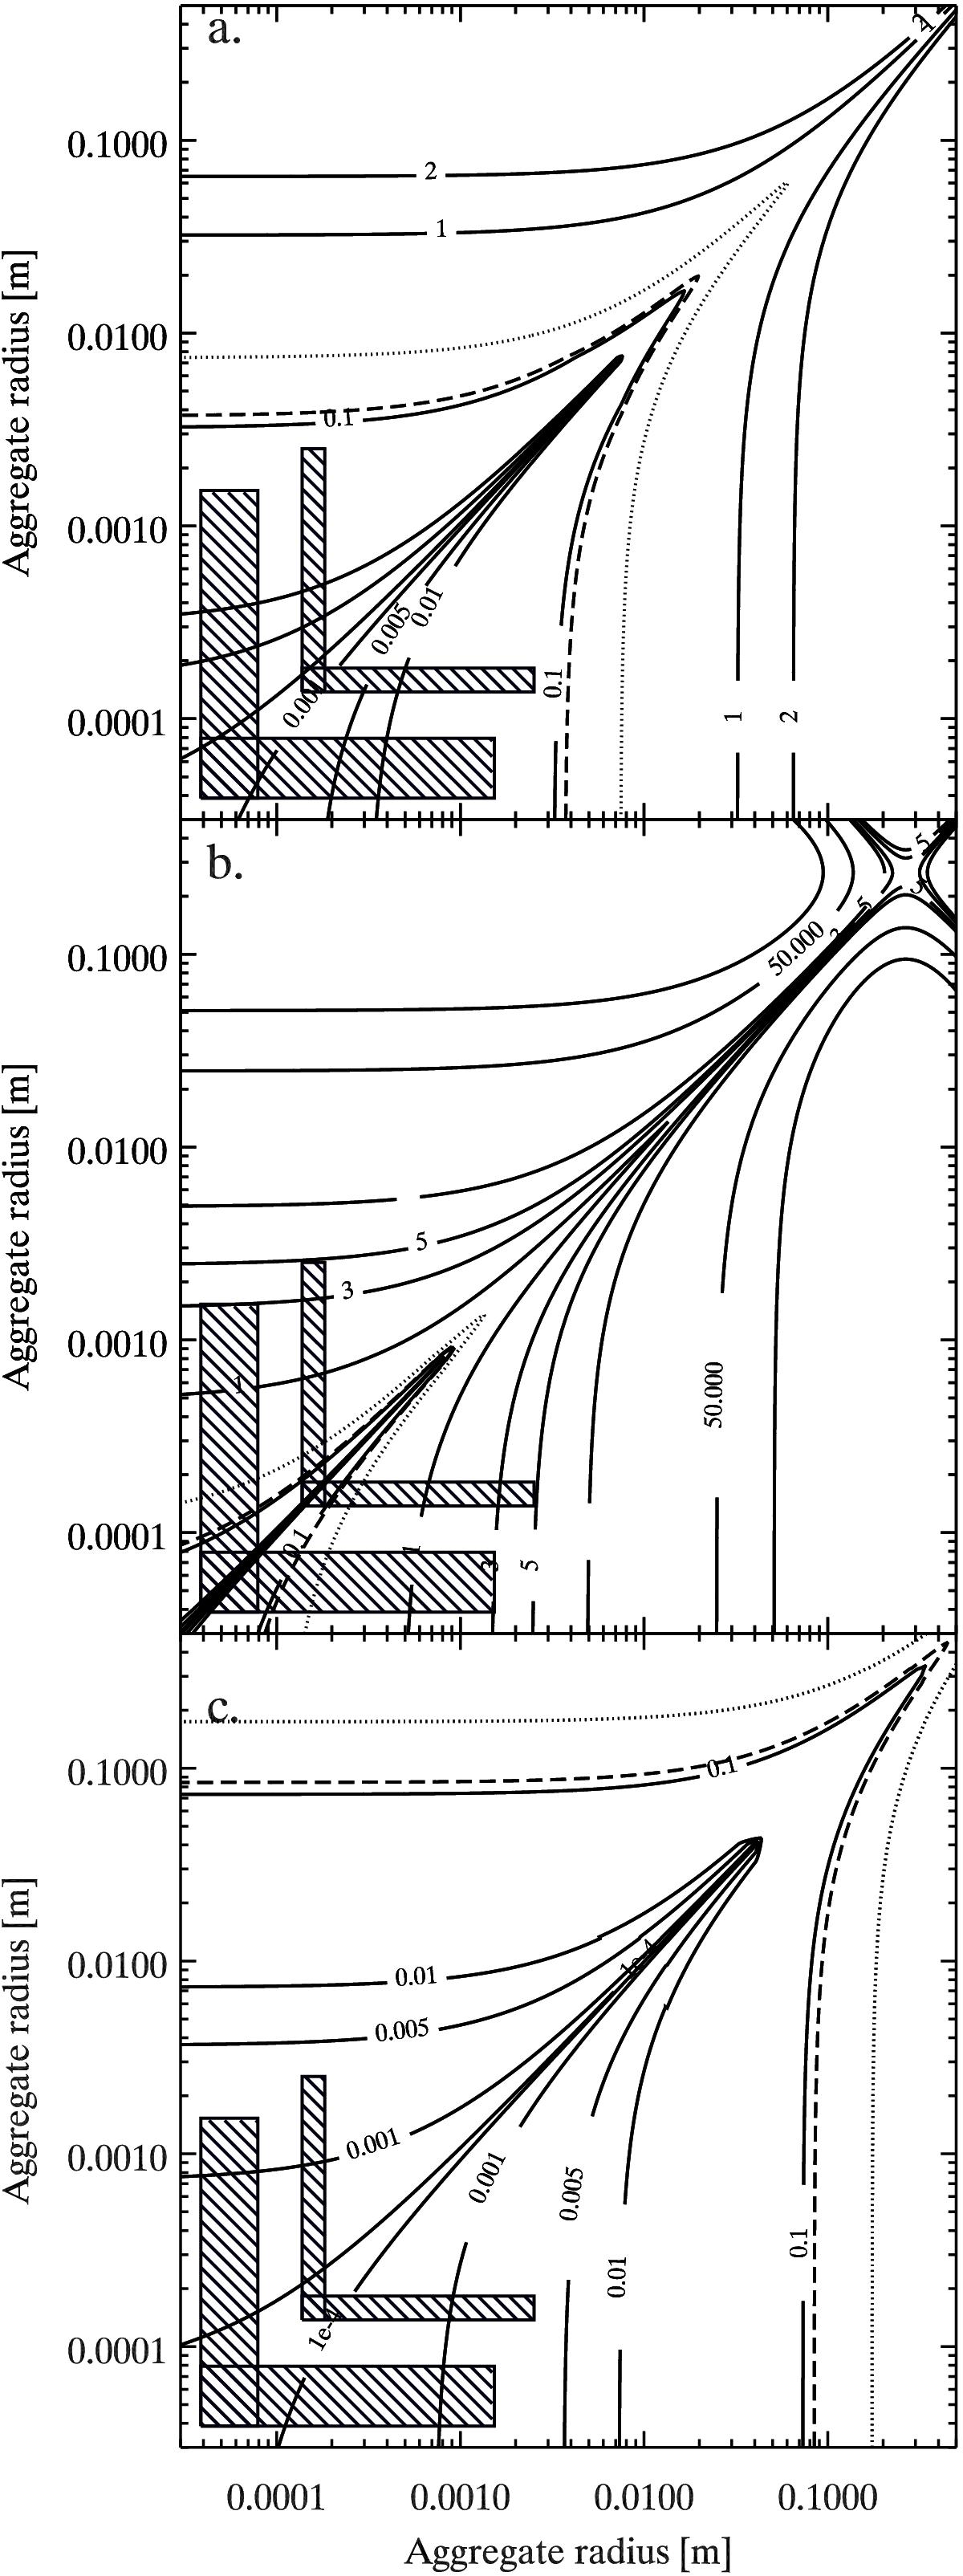
Relative velocities between dust aggregates in a protoplanetary disk computed according to a) Weidenschilling (1977b); b)Andrews & Williams (2007); and c)Desch (2007) at 1 AU and a turbulence parametre of α = 10-5. The velocity profiles are labelled in units of m s-1. The hashed boxes represent the collisions observed during the SPACE experiment (see text for more details). The dashed contour displays the minimum sticking velocity measured during the SPACE experiment for both size distributions. The dotted contour displays the same minimum sticking velocity in the case of aggregate-aggregate collisions instead of aggregate-cluster collisions (see text for details).
Current usage metrics show cumulative count of Article Views (full-text article views including HTML views, PDF and ePub downloads, according to the available data) and Abstracts Views on Vision4Press platform.
Data correspond to usage on the plateform after 2015. The current usage metrics is available 48-96 hours after online publication and is updated daily on week days.
Initial download of the metrics may take a while.