Fig. 13
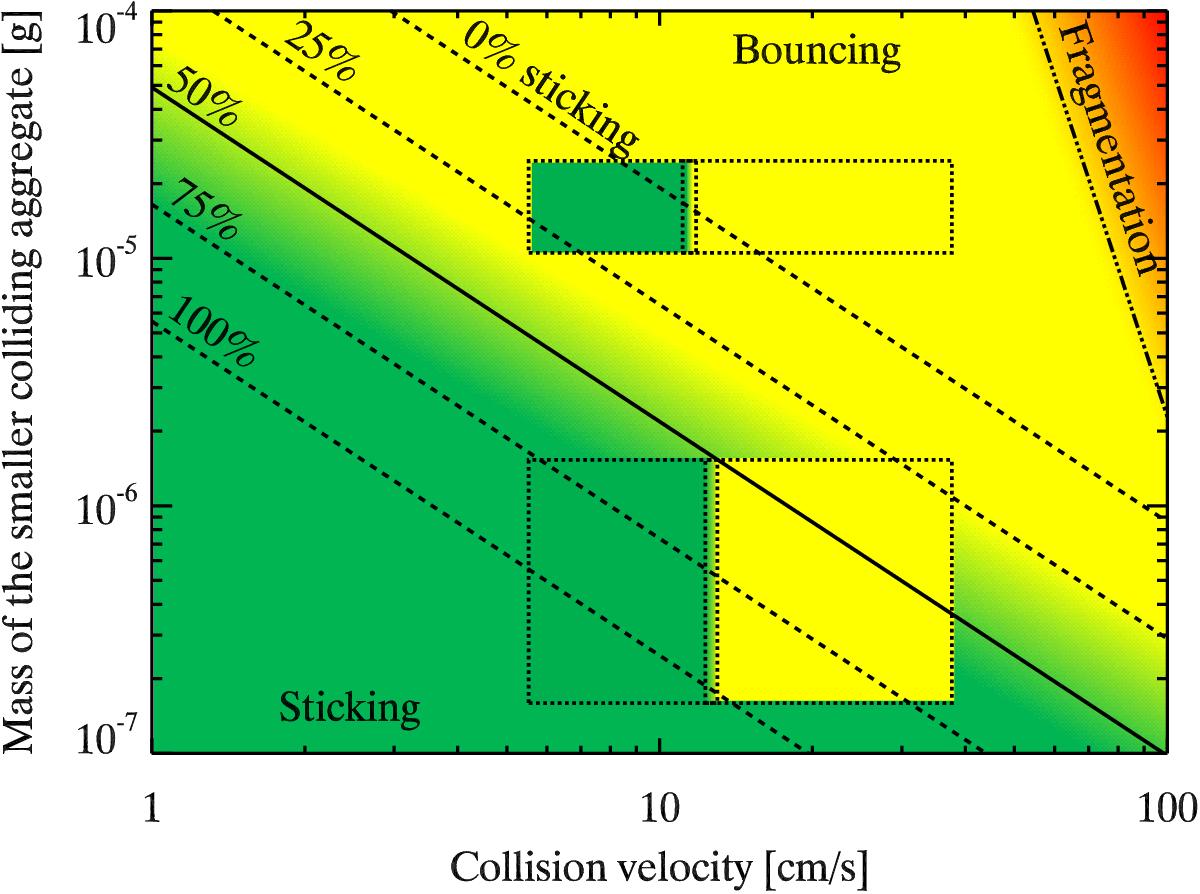
Flight collision results (dotted boxes) according to the aggregate size distributions (box heights) and their mean collision velocities during the experiment (box widths). As the larger aggregates composed of mono- and polydisperse SiO2 grains had very similar sticking properties, only the results for the aggregates composed of monodisperse SiO2 are plotted (upper box). The background colours correspond to the dust collision model developed by Güttler et al. (2010) with updates by Kothe et al. (2013). Green colour represents sticking collisions, yellow bouncing, and red fragmentation, respectively. The lines represent the transition zones between sticking and bouncing (solid line for a 50% sticking probability, dashed lines for 0, 25, 75 and 100% sticking probabilities) as well as the transition between bouncing and fragmentation (dash-dotted line for the onset of fragmentation), computed by Kothe et al. (in prep.). Mind that the collision model by Güttler et al. (2010) and Kothe et al. (2013) was developed for collisions between equal-mass aggregates, whereas the results presented here are dominated by single aggregates colliding with more massive clusters.
Current usage metrics show cumulative count of Article Views (full-text article views including HTML views, PDF and ePub downloads, according to the available data) and Abstracts Views on Vision4Press platform.
Data correspond to usage on the plateform after 2015. The current usage metrics is available 48-96 hours after online publication and is updated daily on week days.
Initial download of the metrics may take a while.