Fig. 12
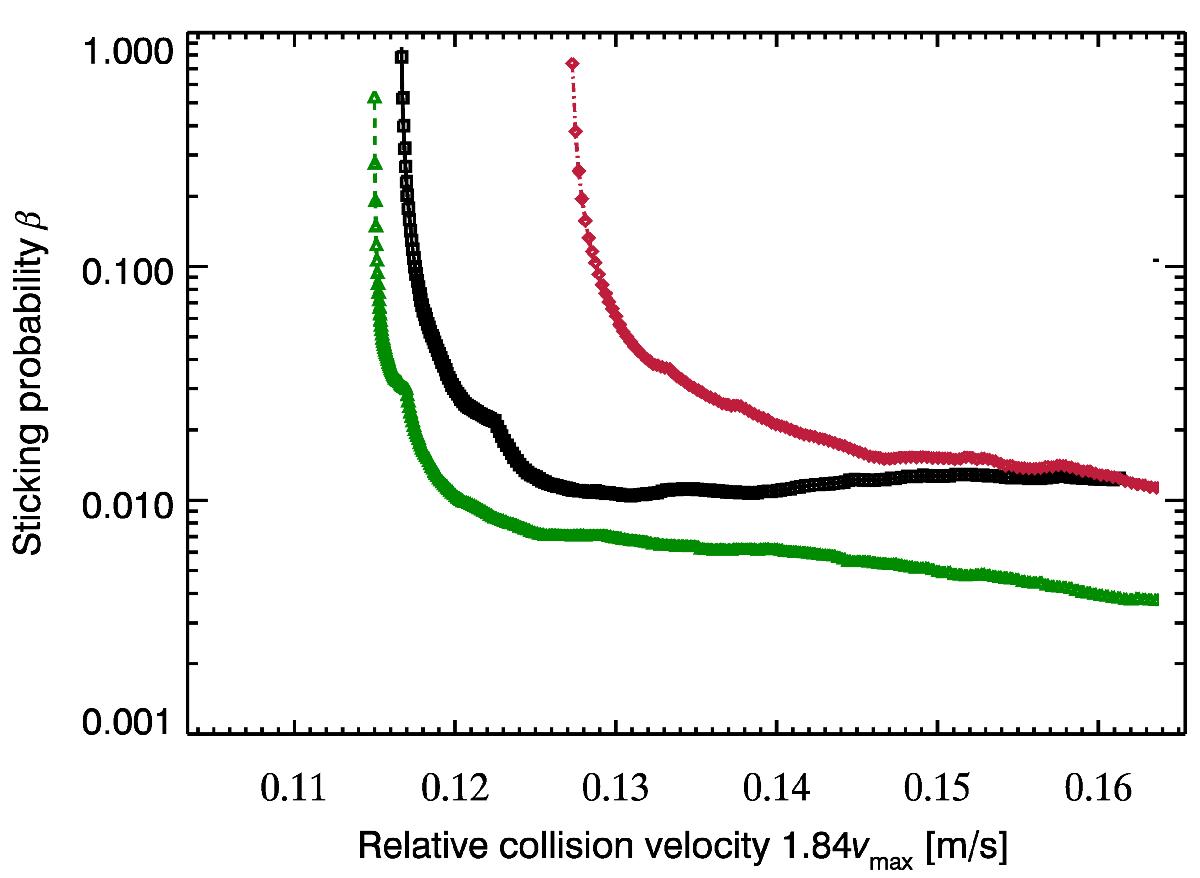
Sticking probability of the three types of dust aggregates investigated in the SPACE experiment plotted as a function of the statistical relative collision velocity computed in Sect. 3.2 (1.84vmax). The large size distribution of aggregates composed of poly- and monodisperse dust are shown by the black solid curve with squares and the green dashed curve with triangles, and the small size distribution of aggregates composed of monodisperse dust is shown by the red dash-dotted curve with diamonds.
Current usage metrics show cumulative count of Article Views (full-text article views including HTML views, PDF and ePub downloads, according to the available data) and Abstracts Views on Vision4Press platform.
Data correspond to usage on the plateform after 2015. The current usage metrics is available 48-96 hours after online publication and is updated daily on week days.
Initial download of the metrics may take a while.