Fig. 11
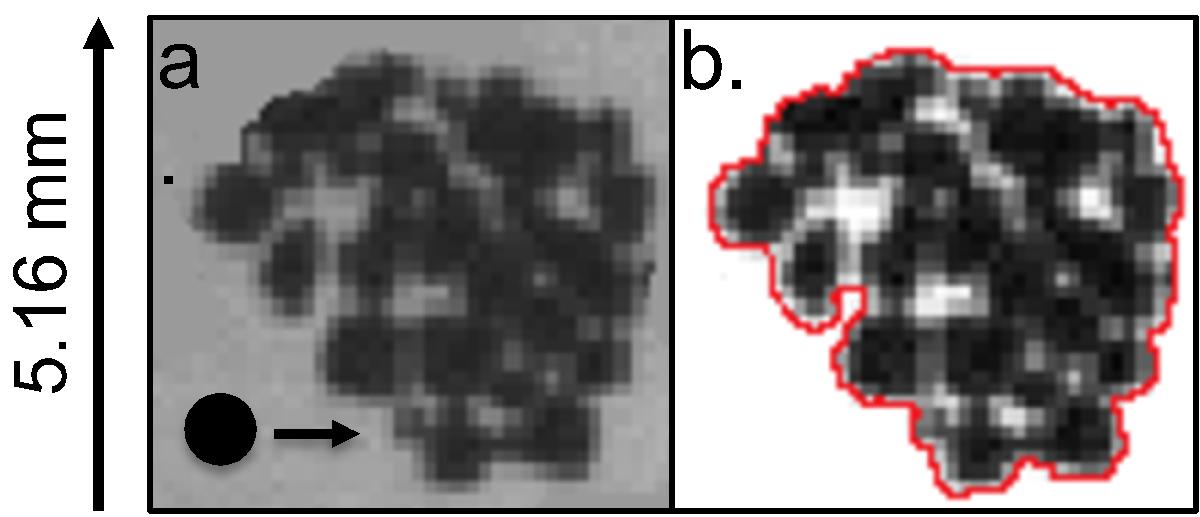
Typical wall cluster during the experiment from the large size distribution of aggregates composed of monodisperse dust. a) Original greyscale image. b) Contrast enhanced image. The red line in b) indicates the delimitation of the total cluster area. The packing density φp = 0.91 is determined by dividing the dark area by the area enclosed by the red line (see Sect. 4.2 for more details on the cluster morphology).
Current usage metrics show cumulative count of Article Views (full-text article views including HTML views, PDF and ePub downloads, according to the available data) and Abstracts Views on Vision4Press platform.
Data correspond to usage on the plateform after 2015. The current usage metrics is available 48-96 hours after online publication and is updated daily on week days.
Initial download of the metrics may take a while.