Free Access
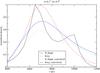
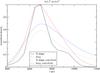
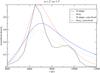
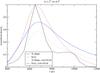
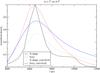
Fig. 9
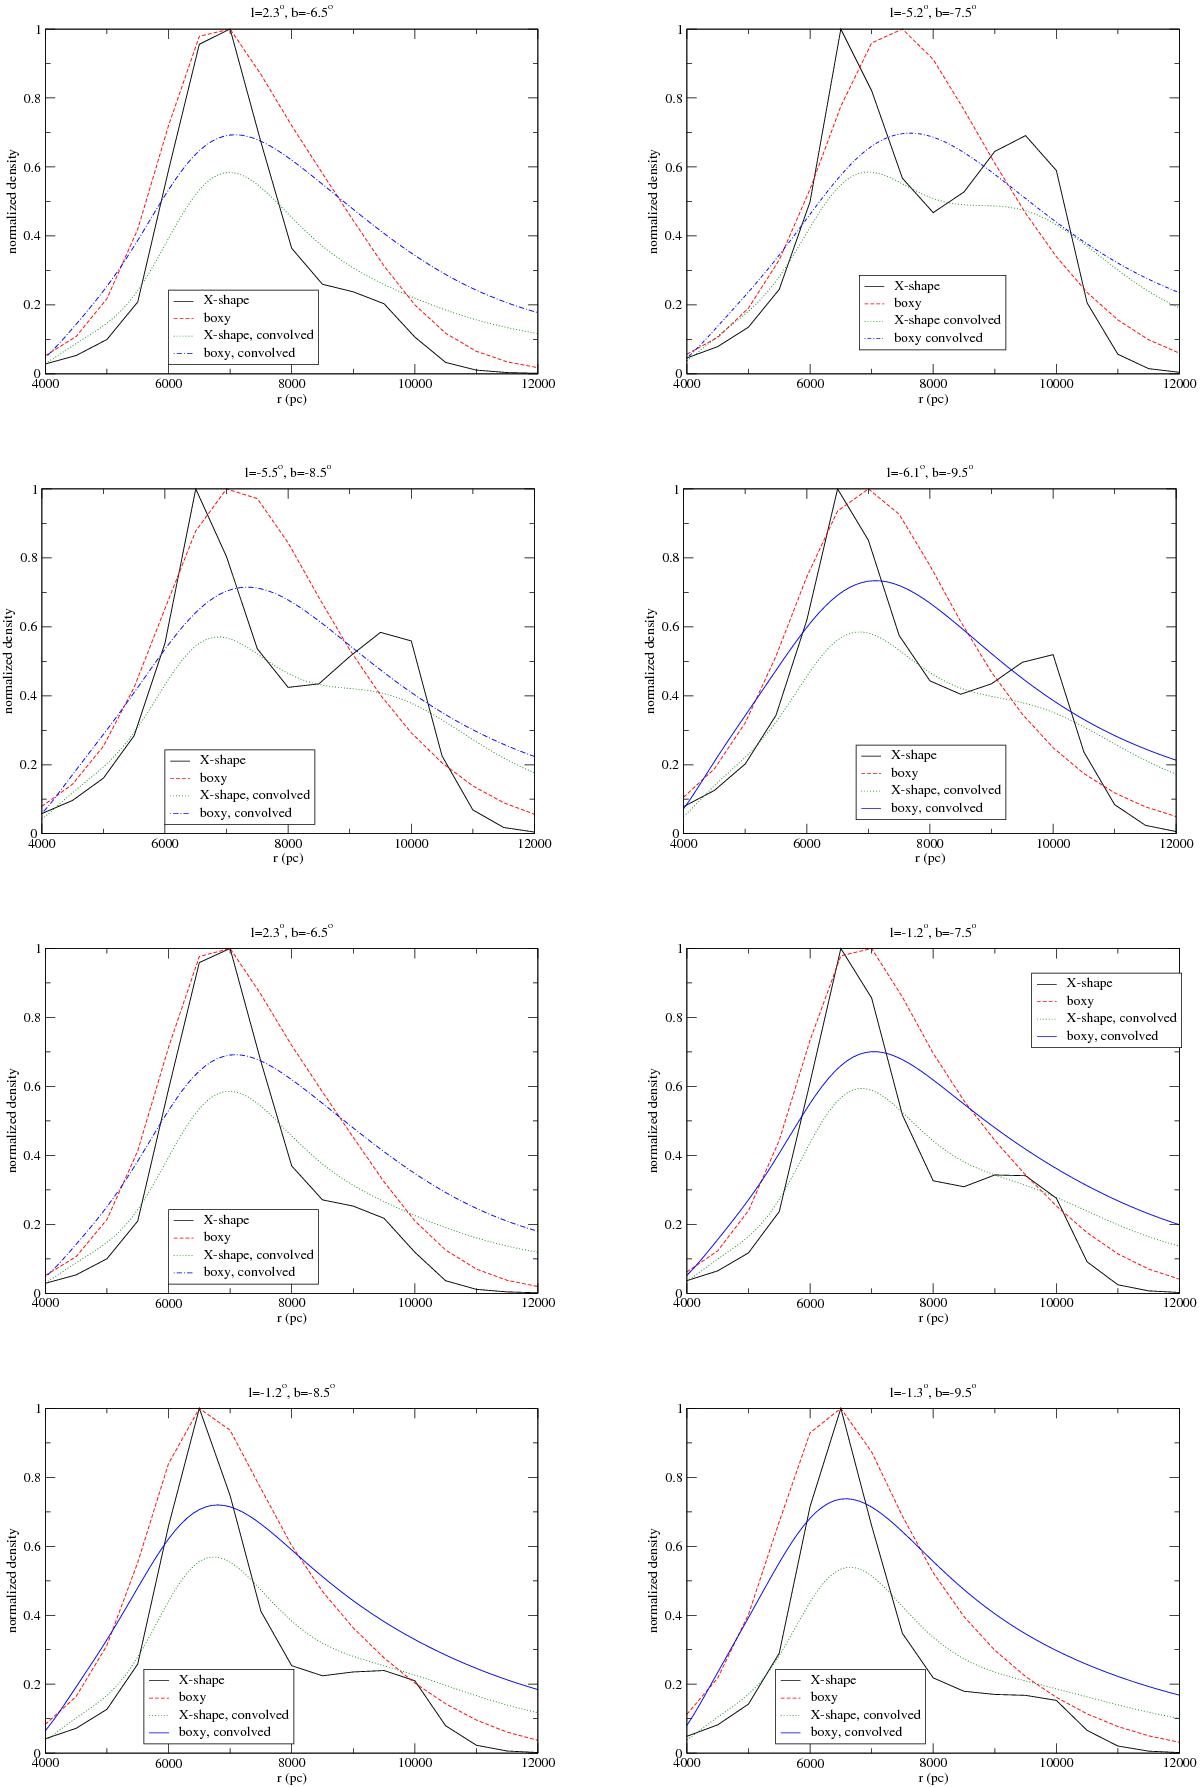
Model predictions of density of X-shaped and boxy bulge for the same lines of sight of Fig. 6. Only the bulge is represented; the disk is not included. The convolved curves correspond to the convolution of the density due to photometric errors, contamination, and dispersion of absolute magnitudes of Eqs. (5), (7), and (8).
This figure is made of several images, please see below:
Current usage metrics show cumulative count of Article Views (full-text article views including HTML views, PDF and ePub downloads, according to the available data) and Abstracts Views on Vision4Press platform.
Data correspond to usage on the plateform after 2015. The current usage metrics is available 48-96 hours after online publication and is updated daily on week days.
Initial download of the metrics may take a while.