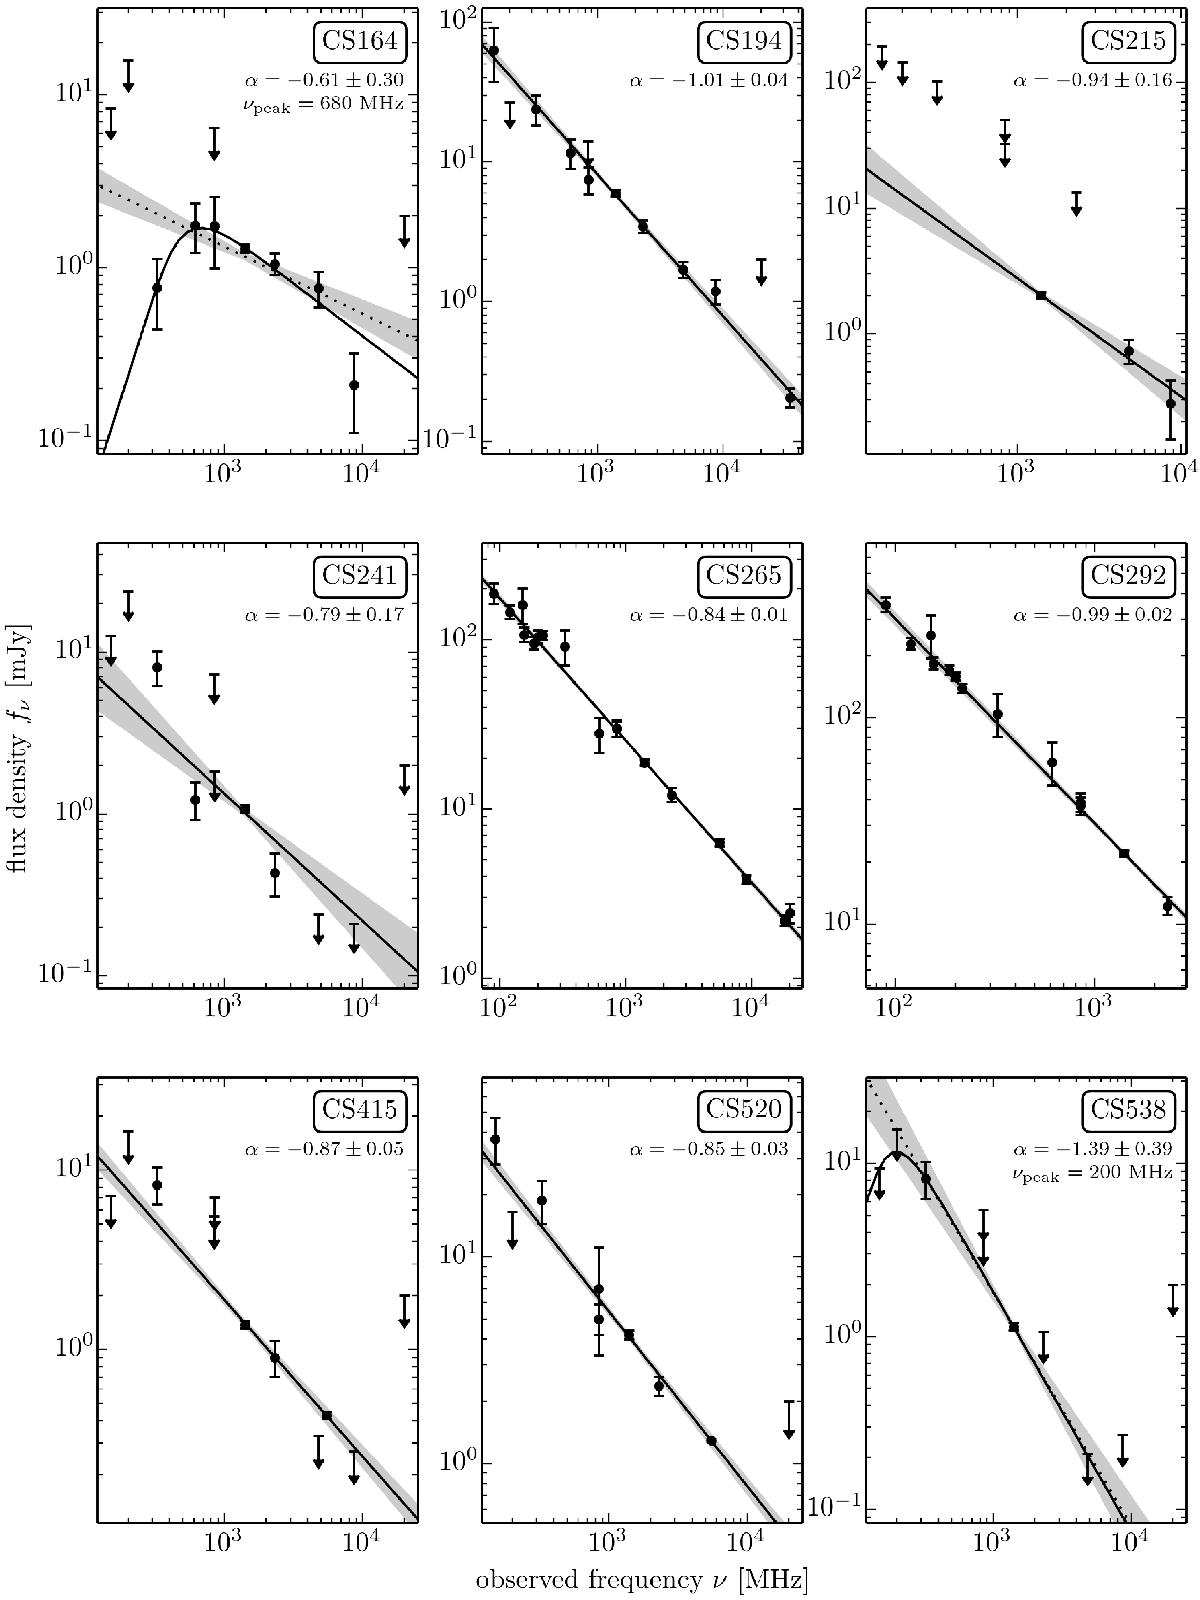
Fig. B.1

Radio SEDs of 31 IFRS in CDFS and ELAIS-S1 not shown in Fig. 2, using all available flux density data points and upper limits. The solid line shows the fit which was found to best describe the photometric detections as discussed in Sect. 3. Spectral index and – if applicable – turnover frequency of the best fit are quoted. We also show the first approach to describe the data – a single power law fitted to all photometric detections – by a dotted line if this fit was discarded later in the analysis. 1σ uncertainties of the single power law fits are represented by the shaded areas. Error bars show 1σ uncertainties. The frequency coverage varies from one IFRS to another and the flux density scales are different.
Current usage metrics show cumulative count of Article Views (full-text article views including HTML views, PDF and ePub downloads, according to the available data) and Abstracts Views on Vision4Press platform.
Data correspond to usage on the plateform after 2015. The current usage metrics is available 48-96 hours after online publication and is updated daily on week days.
Initial download of the metrics may take a while.


