Free Access
Fig. 6
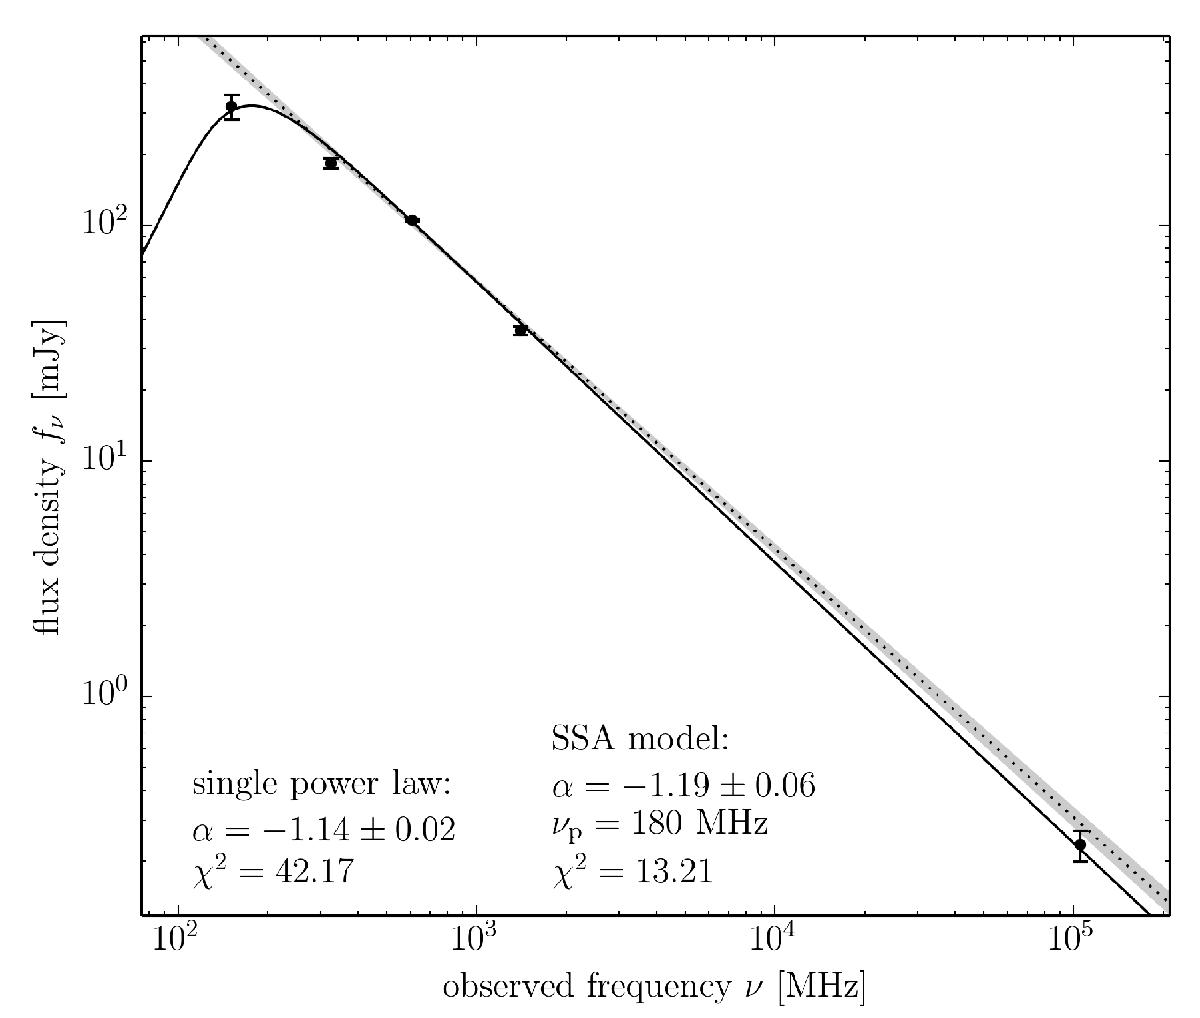
Radio SED of IFRS xFLS 478. Error bars represent 1σ uncertainties. The black solid line shows the best fit of an SSA model. The fitted single power law is shown as black dotted line. The shaded area represents the 1σ uncertainty of the single power law fit.
Current usage metrics show cumulative count of Article Views (full-text article views including HTML views, PDF and ePub downloads, according to the available data) and Abstracts Views on Vision4Press platform.
Data correspond to usage on the plateform after 2015. The current usage metrics is available 48-96 hours after online publication and is updated daily on week days.
Initial download of the metrics may take a while.