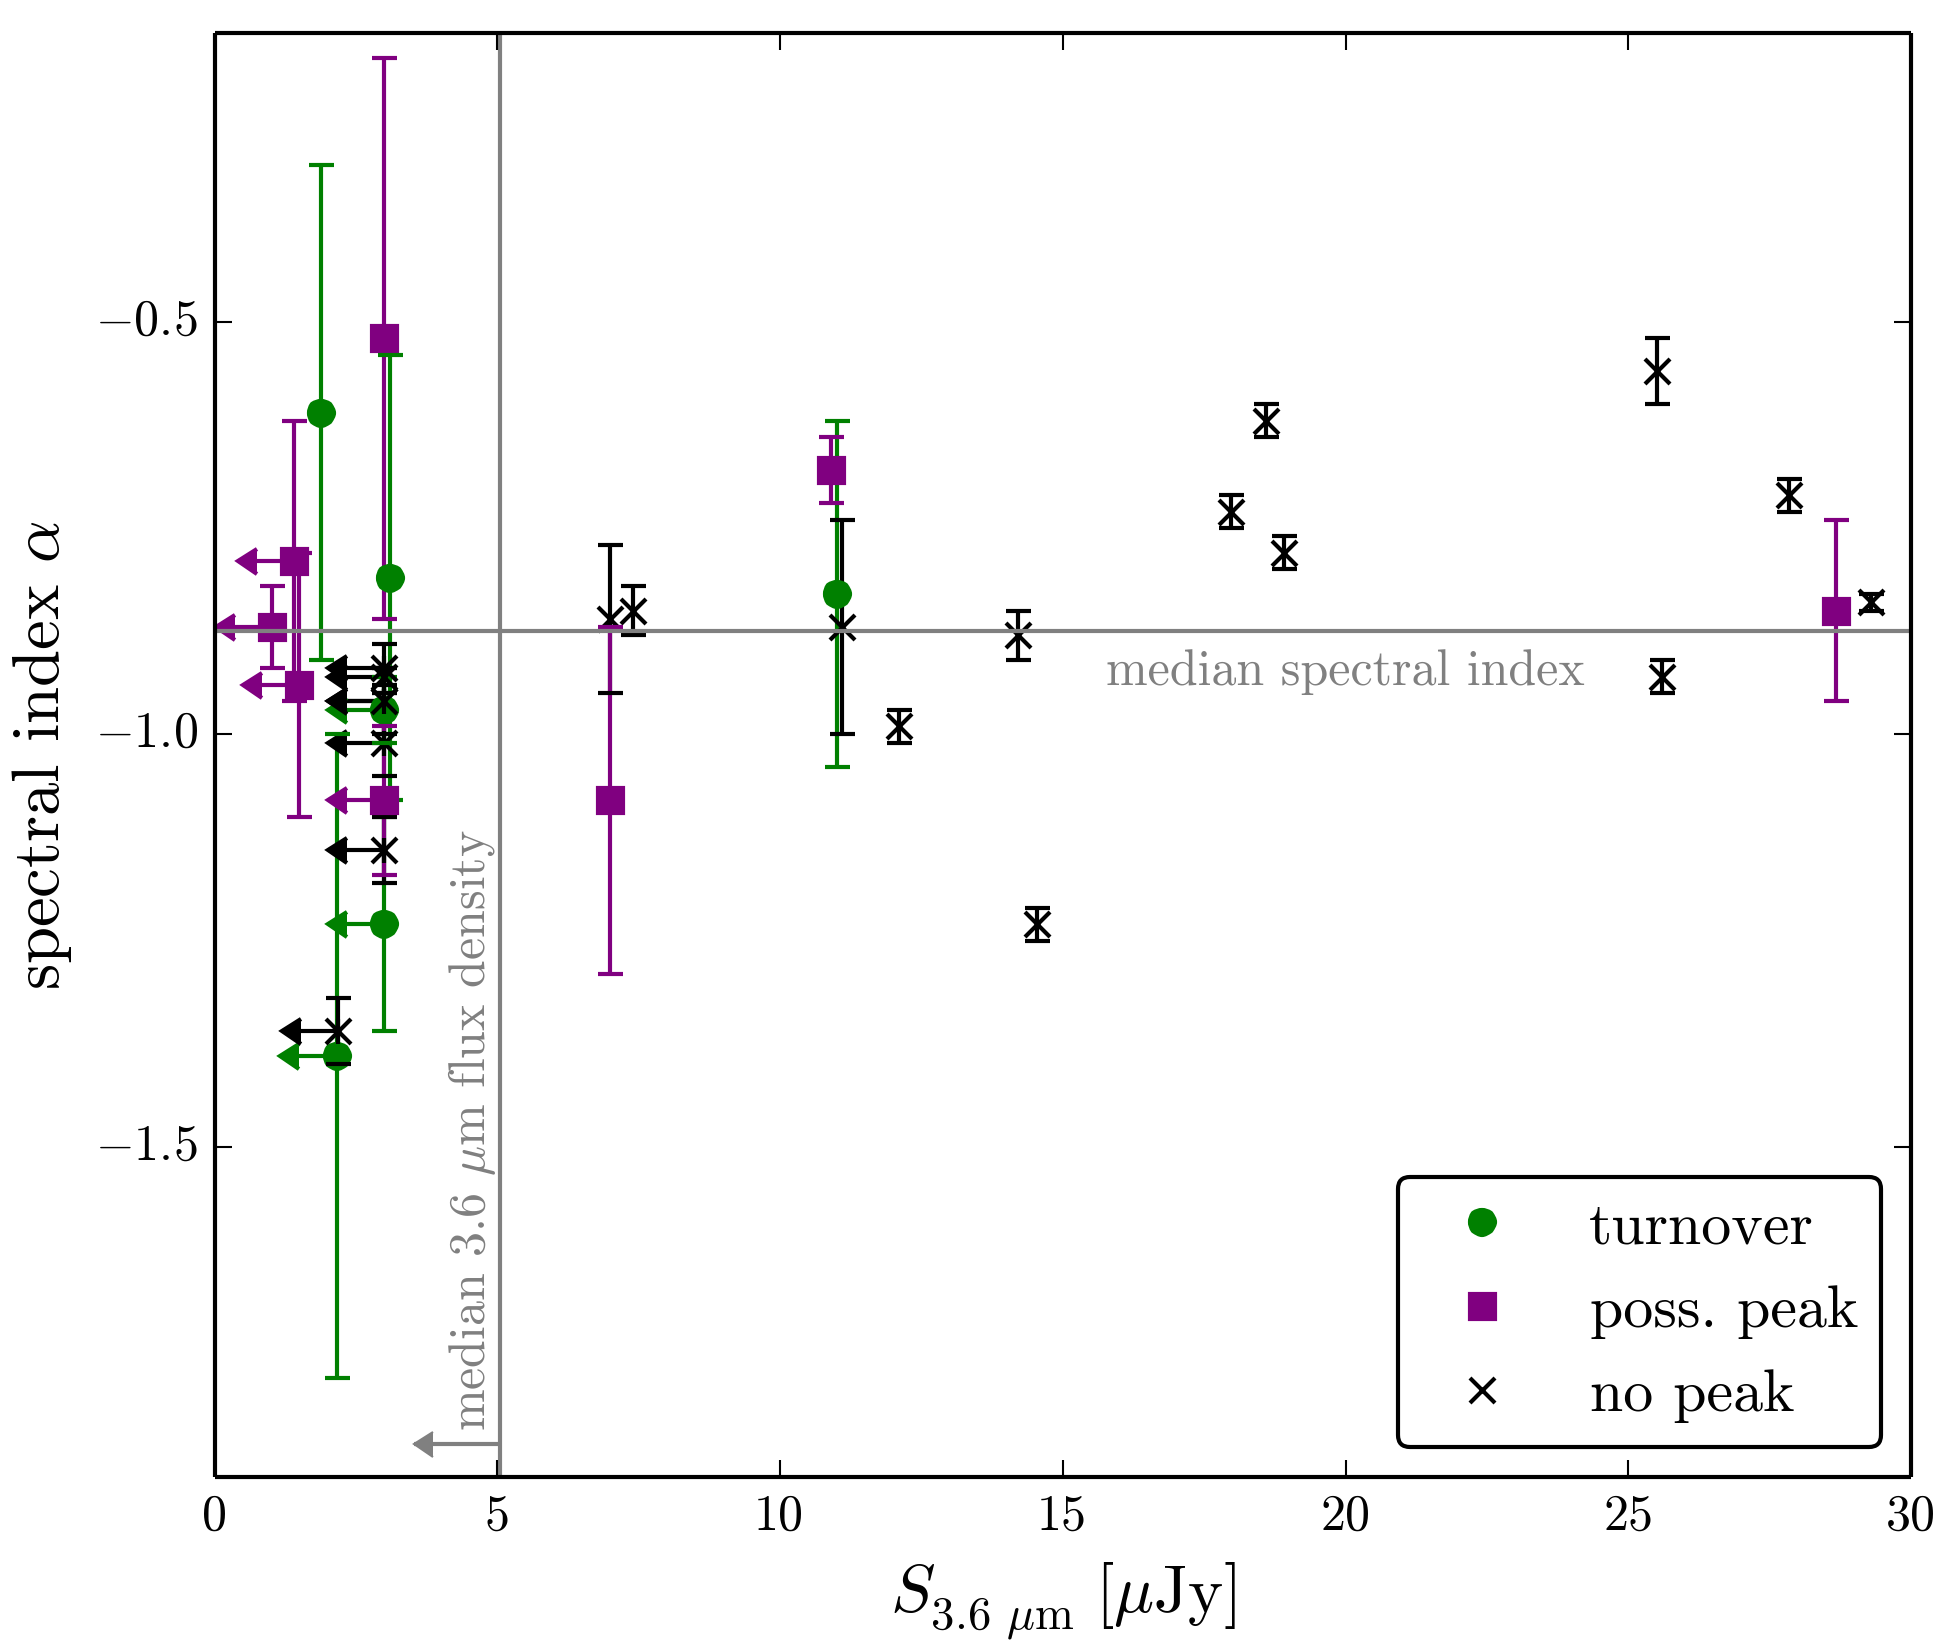
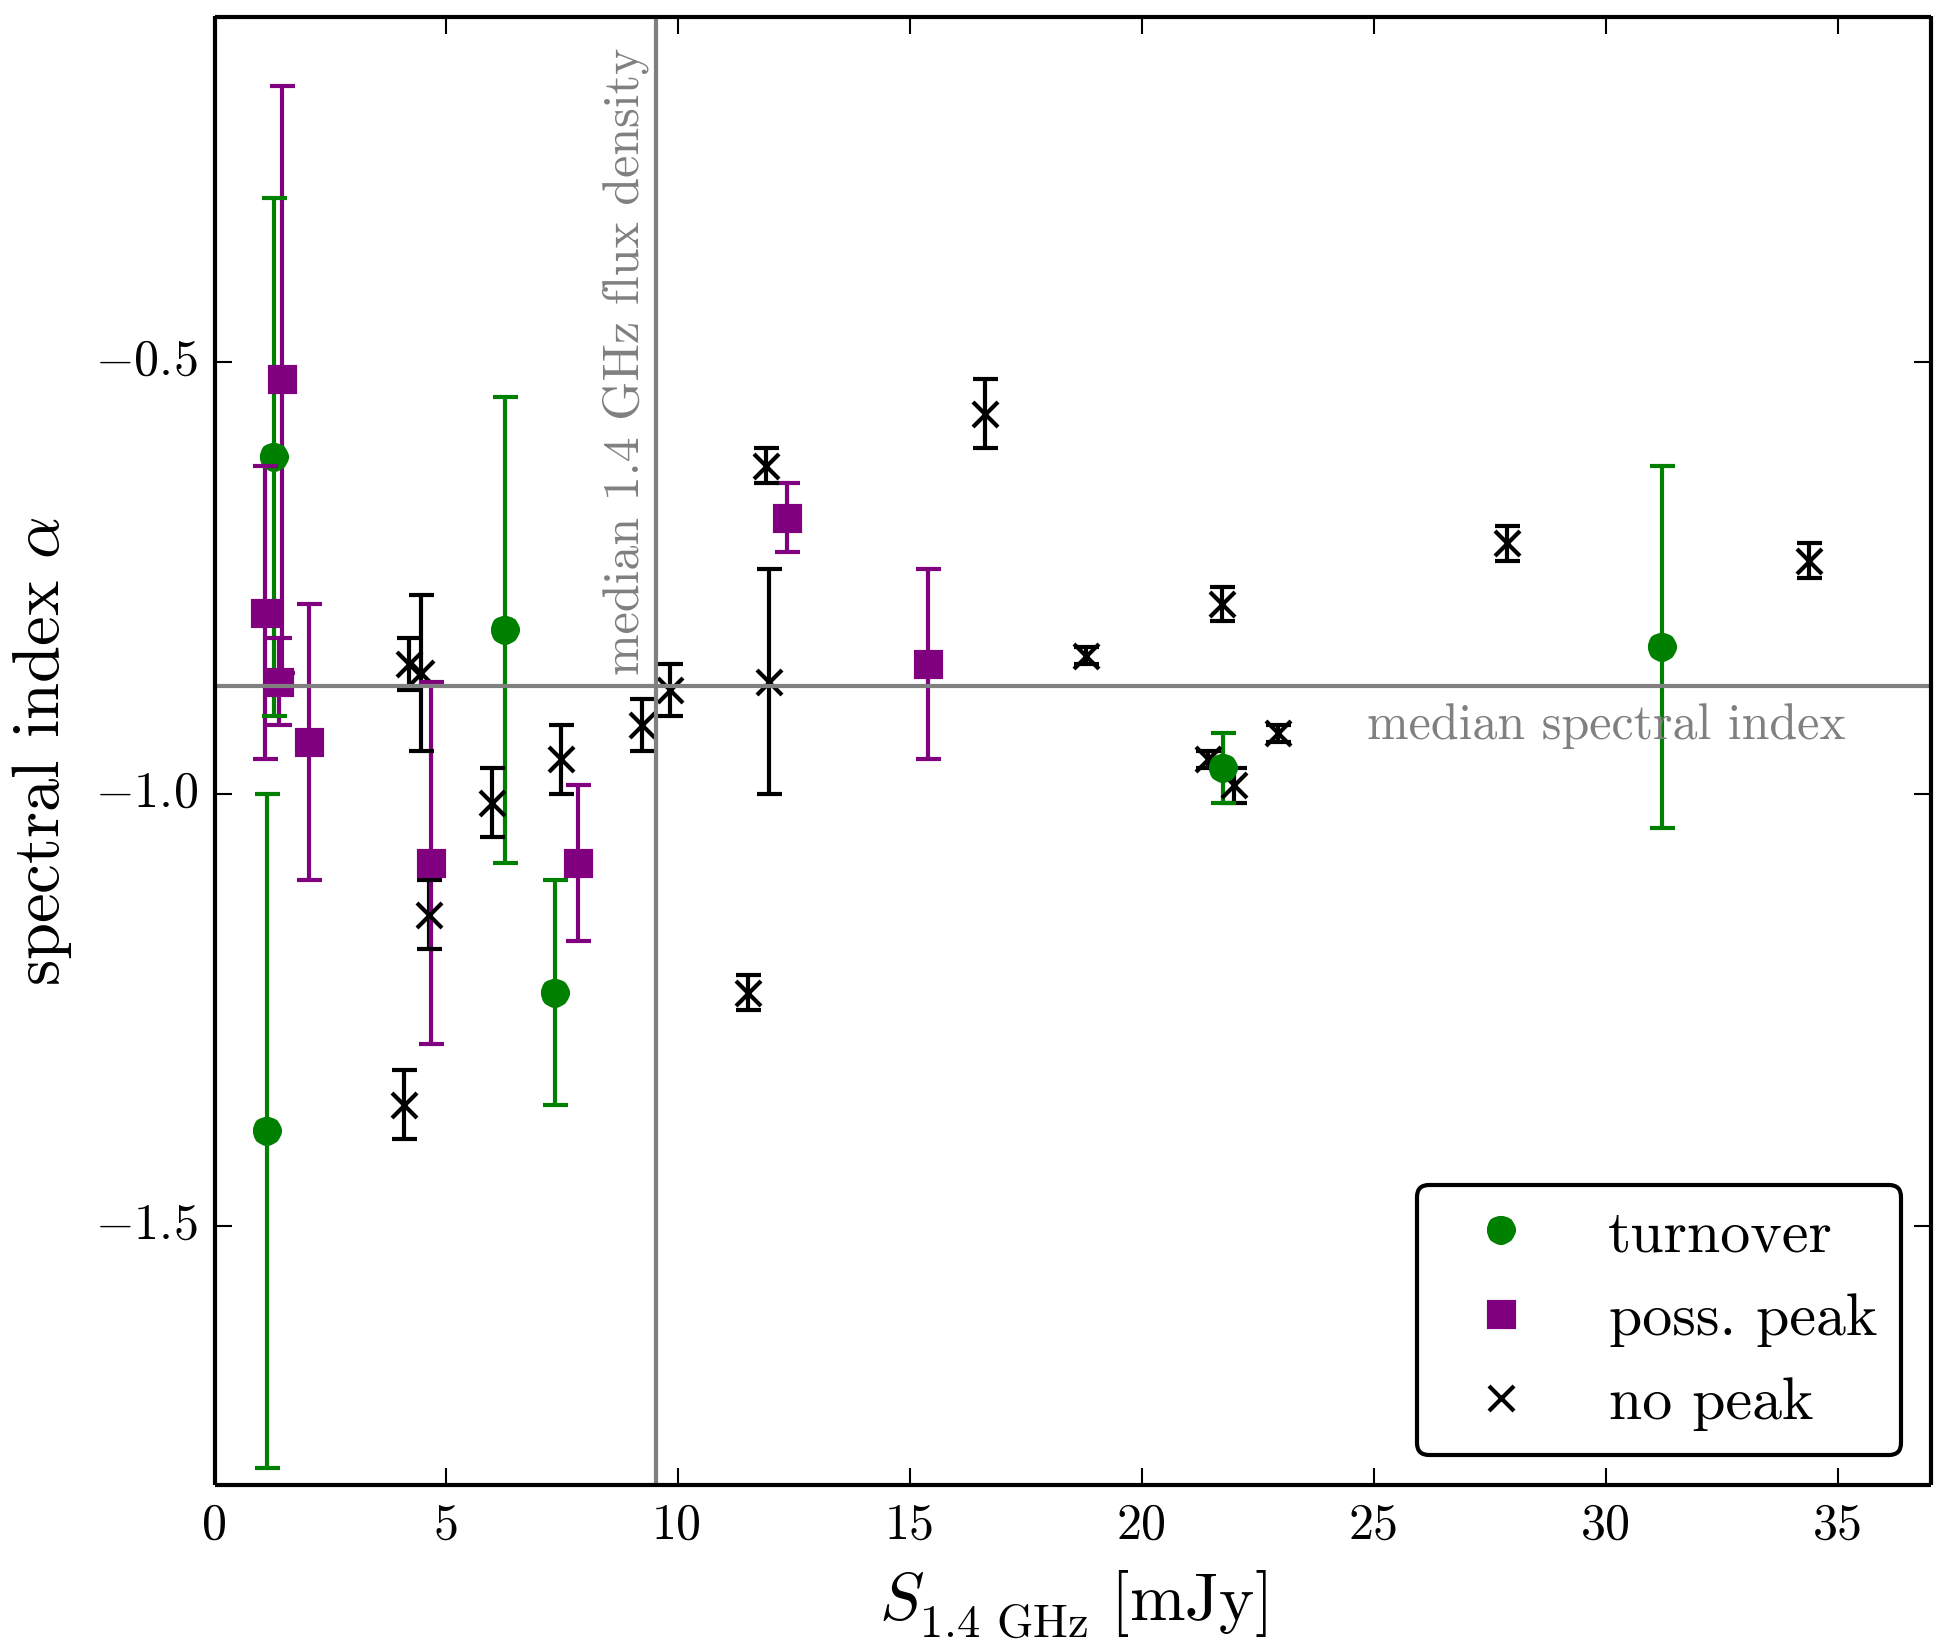
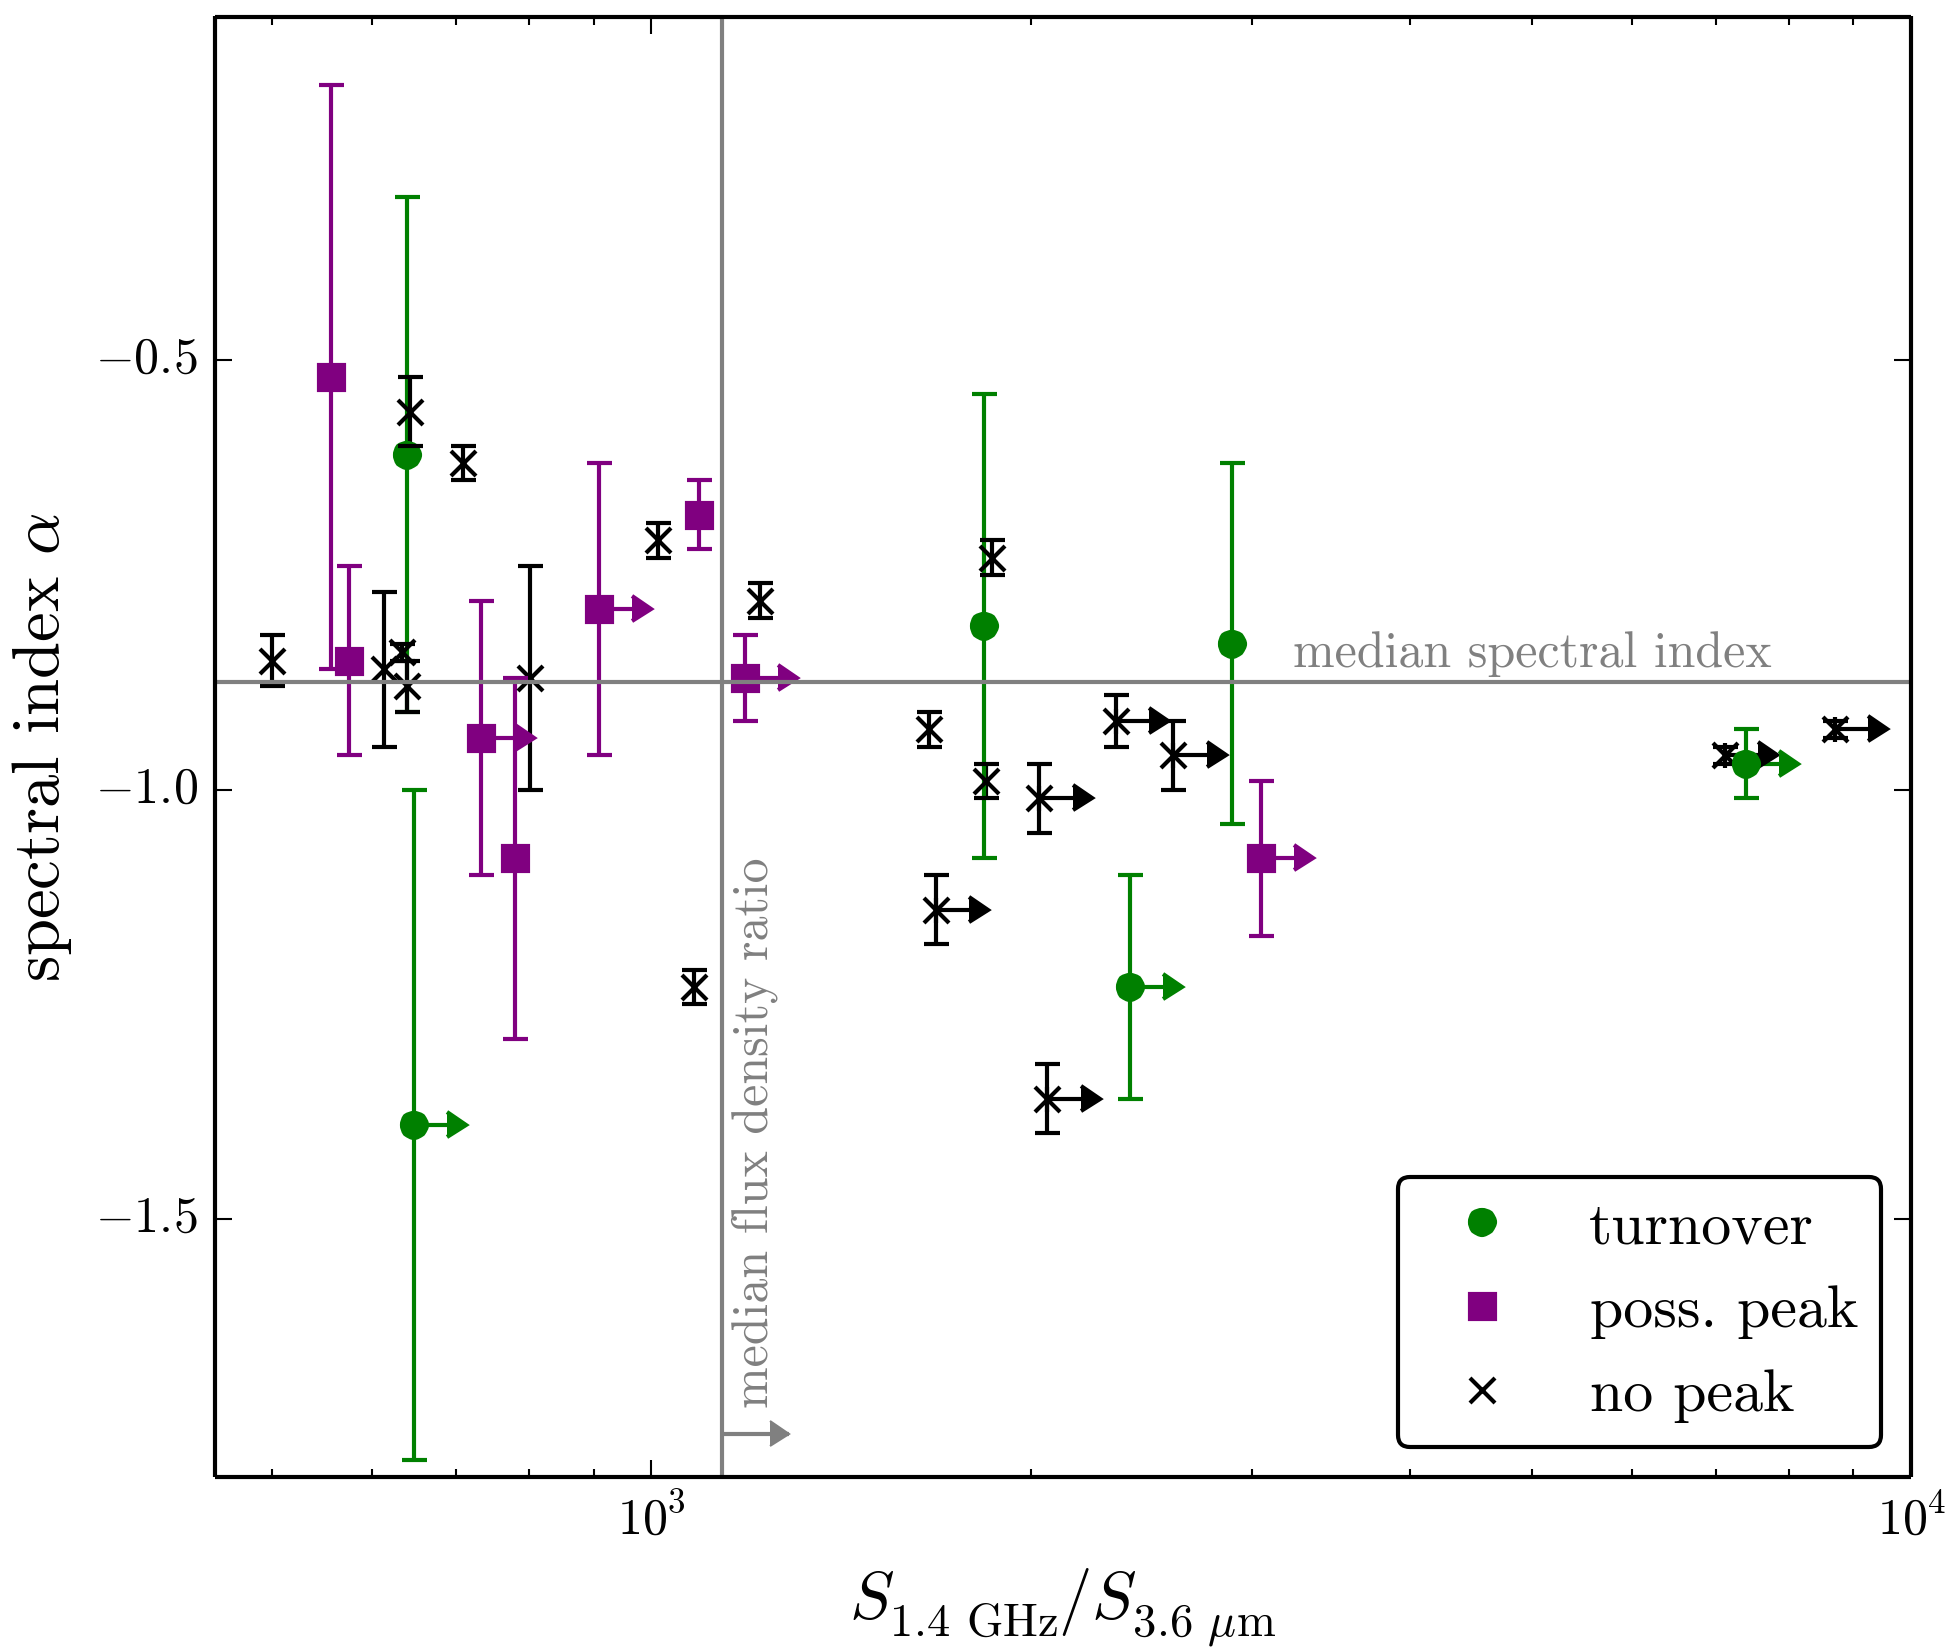
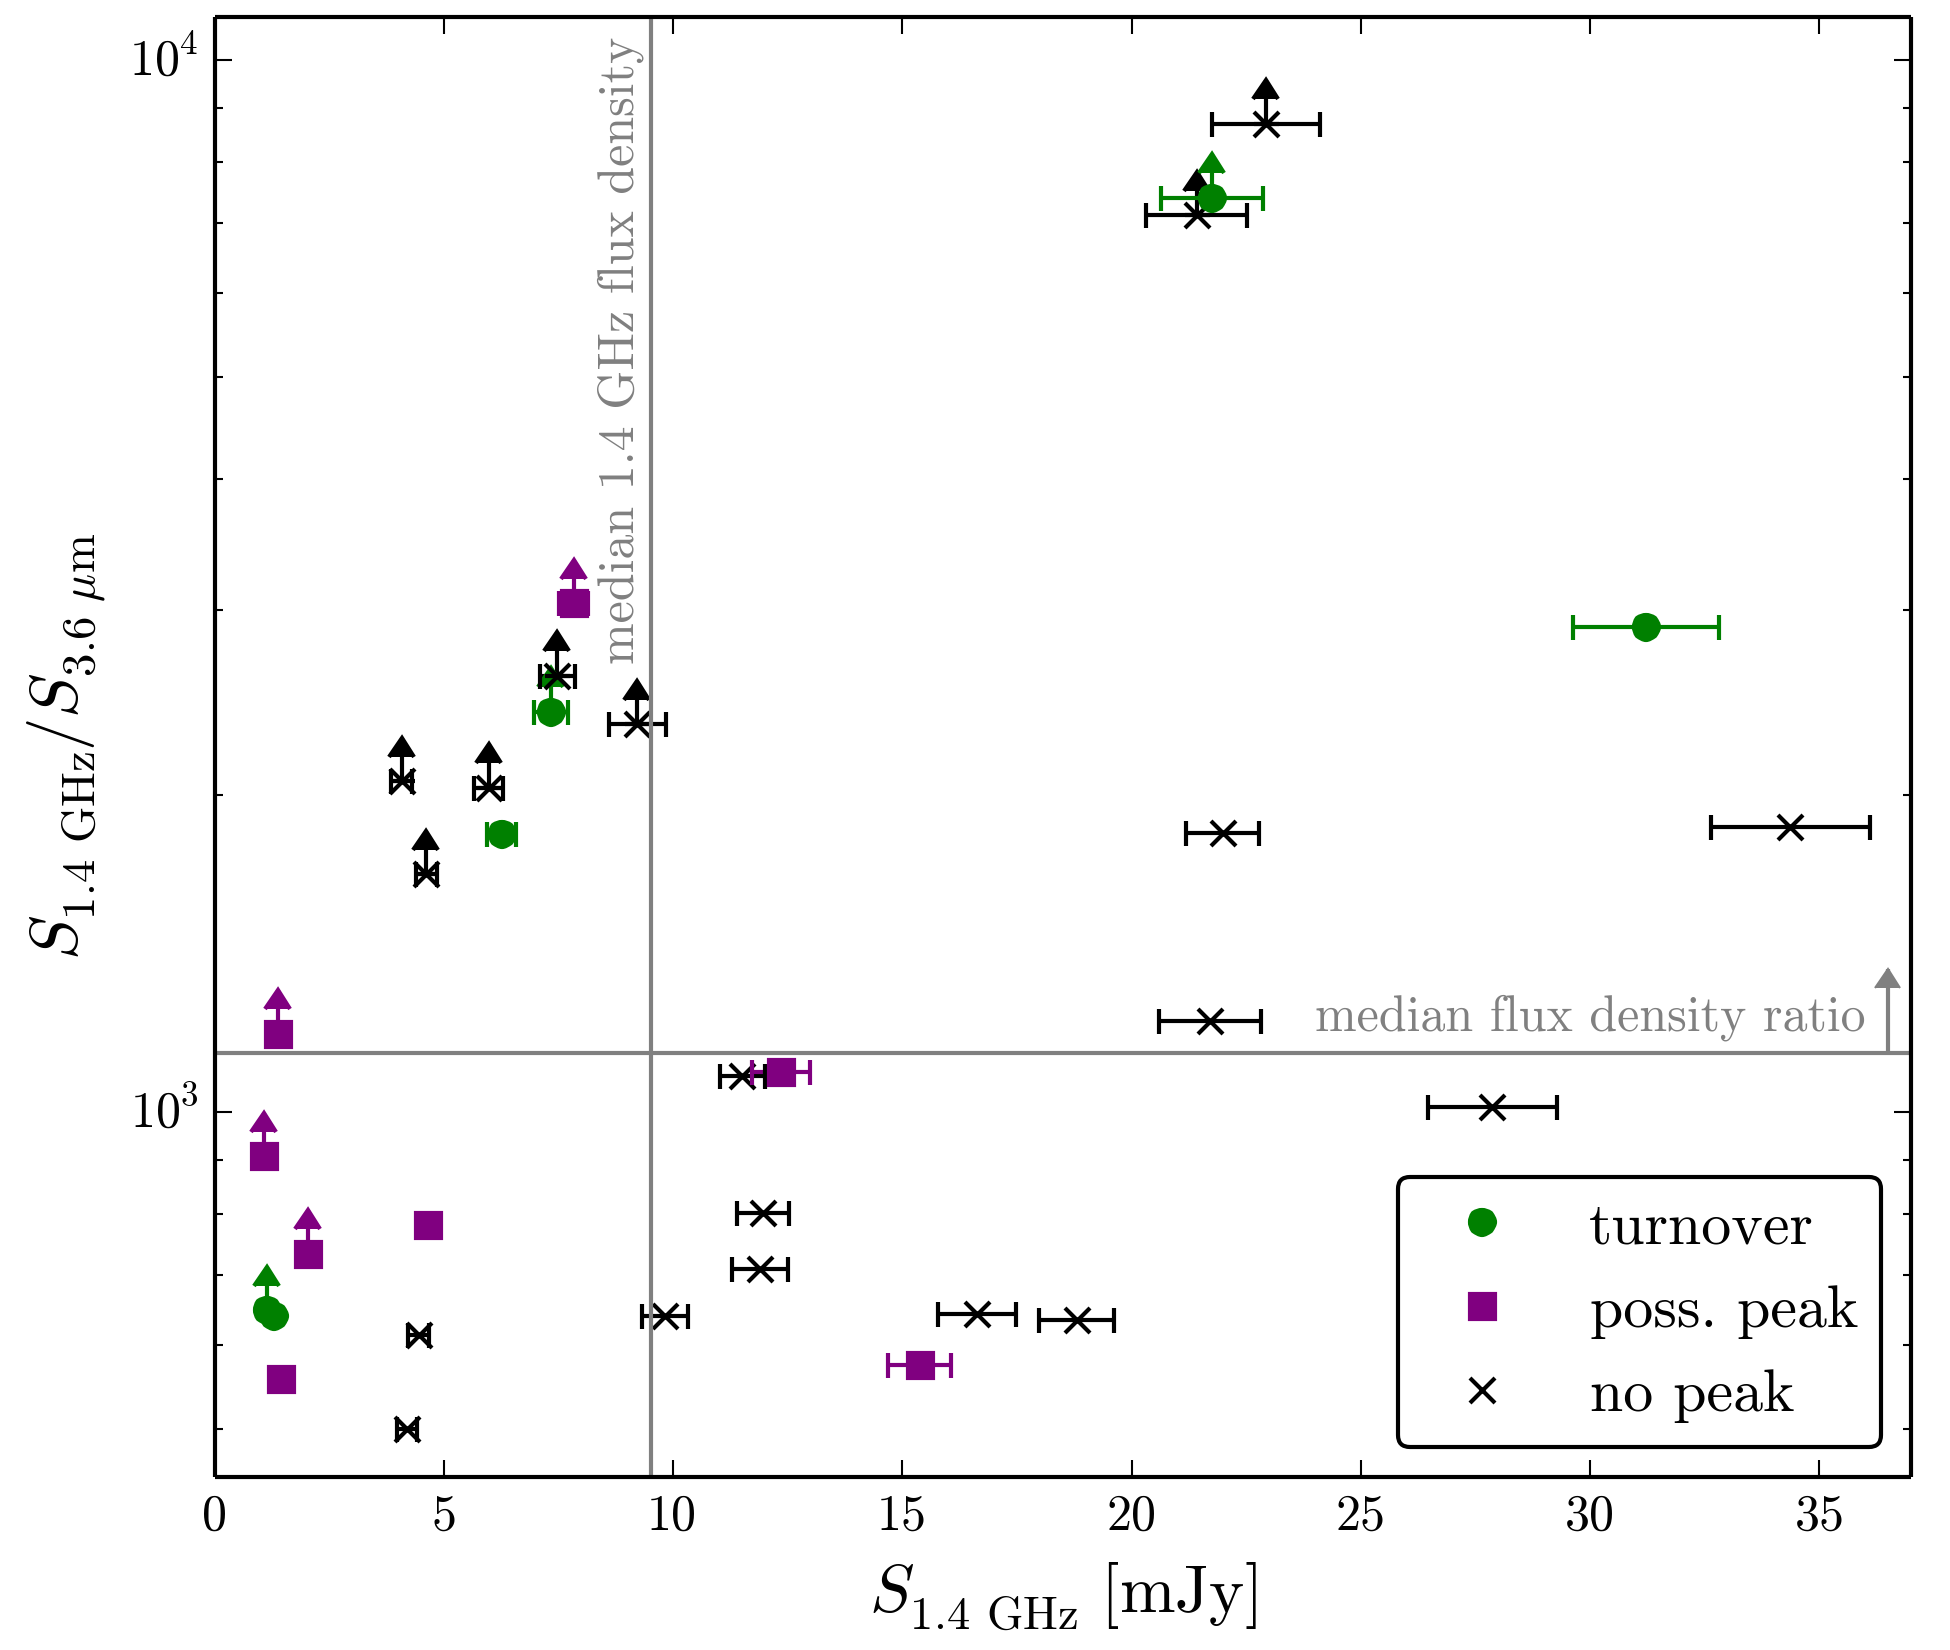
Fig. 4
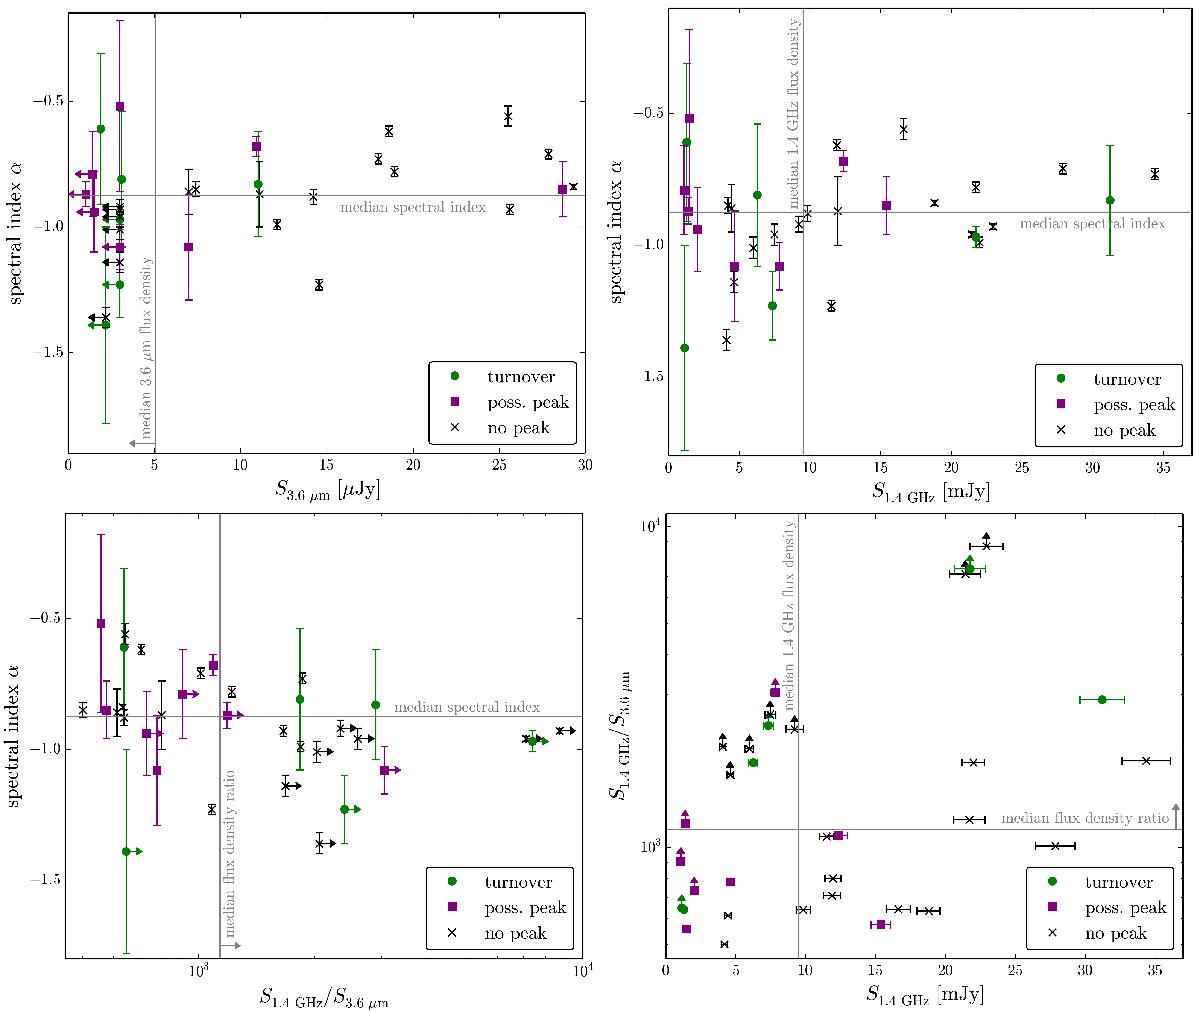
Radio spectral index α as a function of the 3.6 μm flux density (top left), α as a function of the radio flux density S1.4 GHz (top right), α as a function of the radio-to-IR flux density ratio S1.4 GHz/S3.6 μm (bottom left), and S1.4 GHz/S3.6 μm as a function of S1.4 GHz (bottom right) for our sample of 34 IFRS. The symbols distinguish subsamples of different turnover properties. Green dots represent sources with a detected turnover. Sources with a possible peak are shown by purple squares, and sources without a peak by black crosses. The classification is described in Sect. 3 and summarised for individual IFRS in Table 3. Upper and lower limits are represented by arrows. The grey horizontal and vertical lines indicate the medians or limits of the median.

Current usage metrics show cumulative count of Article Views (full-text article views including HTML views, PDF and ePub downloads, according to the available data) and Abstracts Views on Vision4Press platform.
Data correspond to usage on the plateform after 2015. The current usage metrics is available 48-96 hours after online publication and is updated daily on week days.
Initial download of the metrics may take a while.