Fig. 2
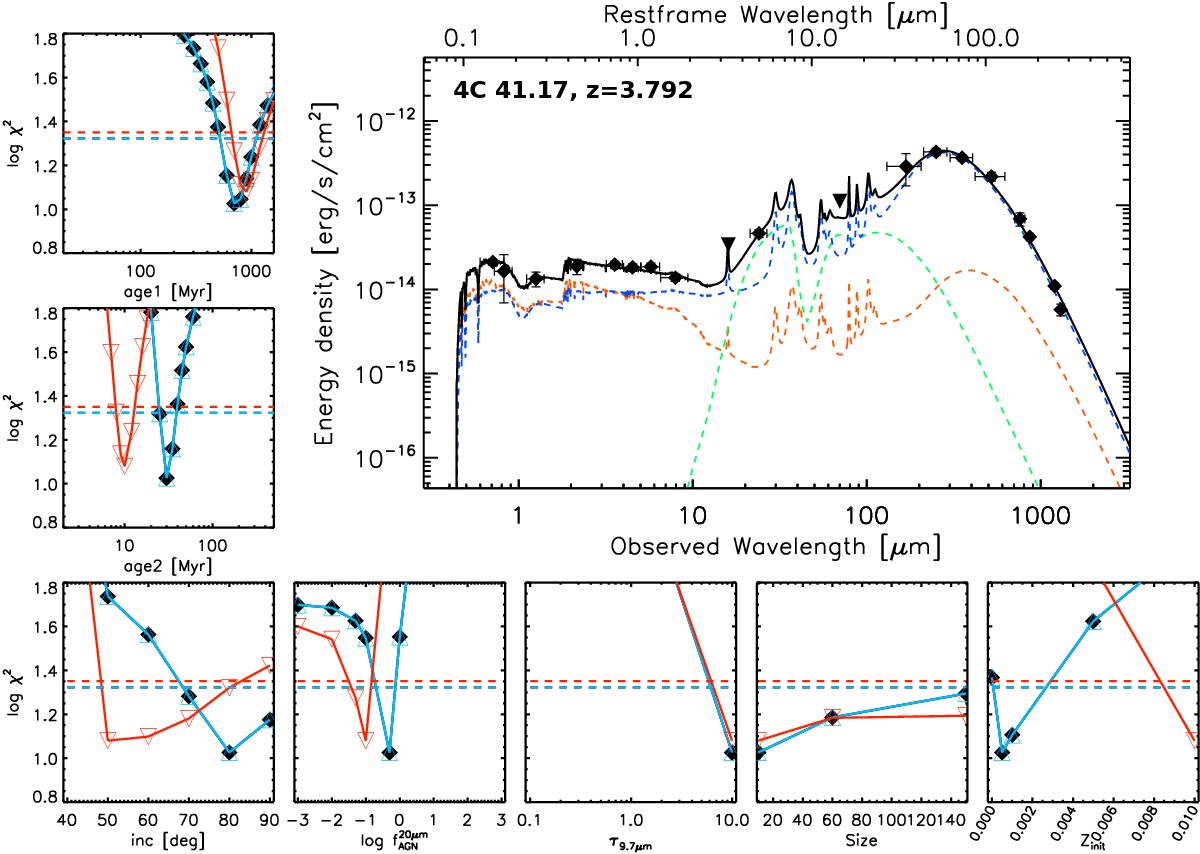
Best fit for 4C 41.17 (z = 3.792). The orange, blue and green dashed lines symbolise the evolved, starburst, and AGN components, respectively. The sum of the components is the dark line, the black diamonds correspond to broad-band photometry, the vertical lines to the 1σ uncertainties and horizontal lines to the FWHM of the filters. The downward triangles represent the 3σ upper limits. The insets show the χ2 distribution for seven of the free parameters of the fit. From top left to bottom right: age of the evolved component (orange line in the SED), age of the starburst (blue line in the SED), inclination of the AGN torus (green line in the SED), fraction of the AGN at 20 μm, equatorial opacity of the torus, size of the torus and initial metallicity of the starburst. Black, blue and red indicate the three different approaches we used to estimate the polarisation effect, without, with the lowest and the highest contamination, respectively. We note that in this case the lowest polarisation contribution is zero, hence the black and blue lines are superposed. The horizontal coloured lines correspond to the 68% confidence interval described in Sect. 3.3.
Current usage metrics show cumulative count of Article Views (full-text article views including HTML views, PDF and ePub downloads, according to the available data) and Abstracts Views on Vision4Press platform.
Data correspond to usage on the plateform after 2015. The current usage metrics is available 48-96 hours after online publication and is updated daily on week days.
Initial download of the metrics may take a while.