Free Access
Fig. 6
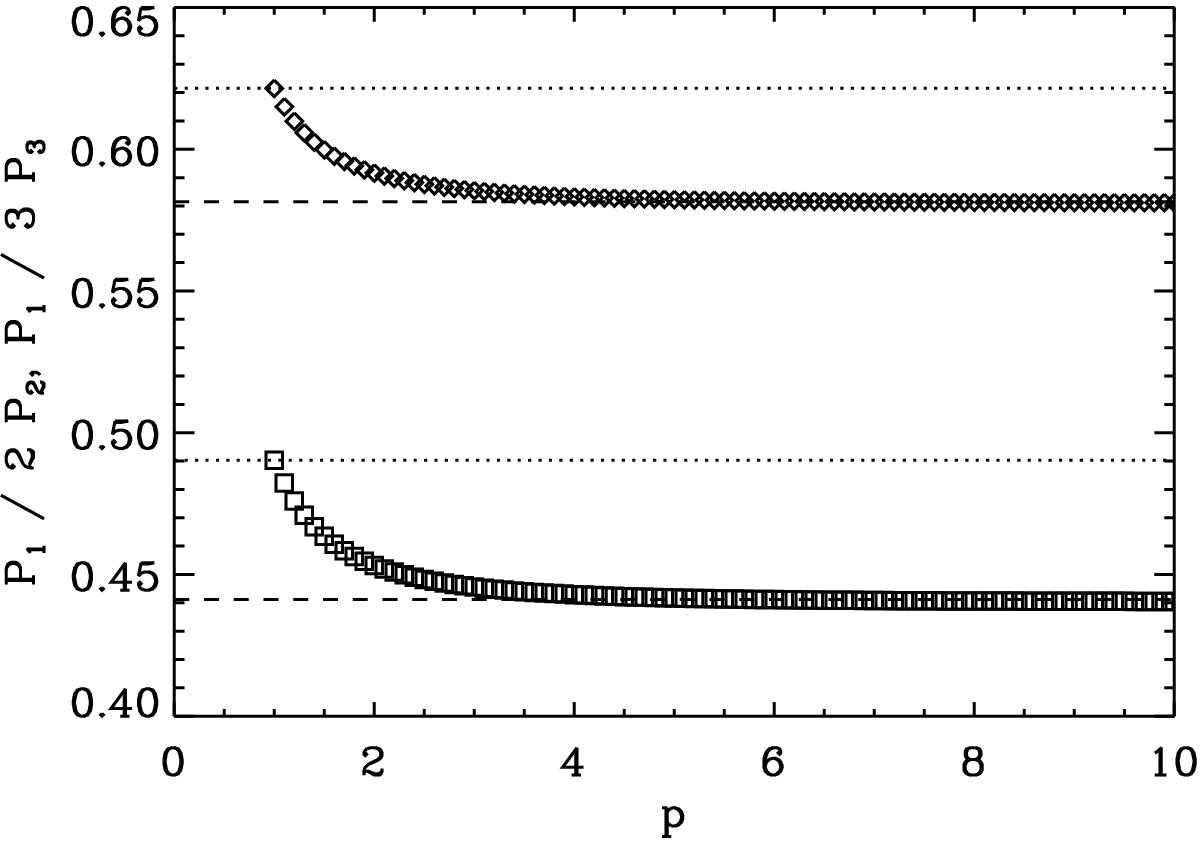
Period ratios P1/ 2P2 (triangles) and P1/ 3P3 (squares) as a function of the density profile steepness parameter. The symbols represent numerical calculations. The dotted and dashed lines correspond to the analytical expressions for the Epstein and step profiles, respectively.
Current usage metrics show cumulative count of Article Views (full-text article views including HTML views, PDF and ePub downloads, according to the available data) and Abstracts Views on Vision4Press platform.
Data correspond to usage on the plateform after 2015. The current usage metrics is available 48-96 hours after online publication and is updated daily on week days.
Initial download of the metrics may take a while.