Free Access
Fig. 4
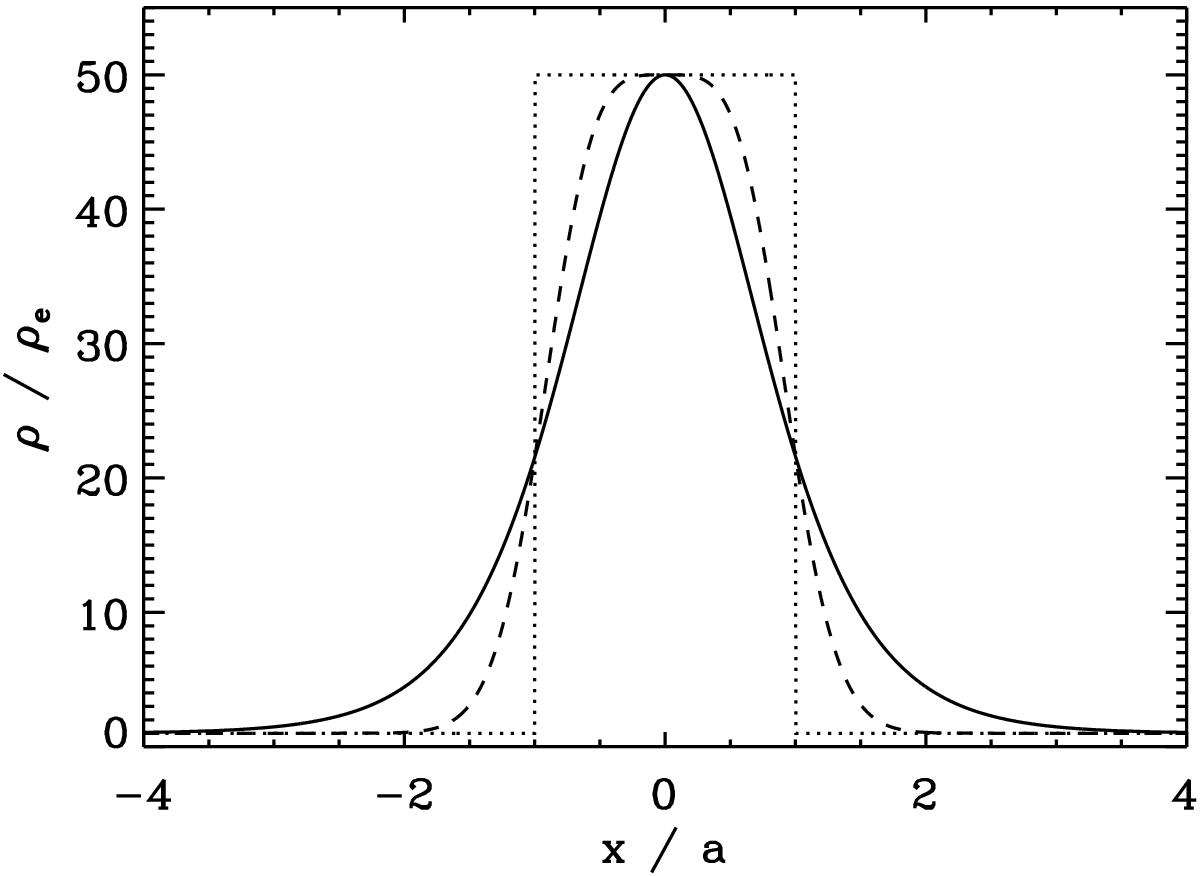
Density profiles for a loop with contrast ratio ρ0/ρe = 50 and different steepness parameters p. The solid line is the Epstein profile (p = 1). The dashed line corresponds to p = 2, while the dotted line is a step function profile (p → ∞).
Current usage metrics show cumulative count of Article Views (full-text article views including HTML views, PDF and ePub downloads, according to the available data) and Abstracts Views on Vision4Press platform.
Data correspond to usage on the plateform after 2015. The current usage metrics is available 48-96 hours after online publication and is updated daily on week days.
Initial download of the metrics may take a while.