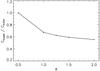
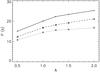
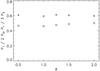
Fig. 13
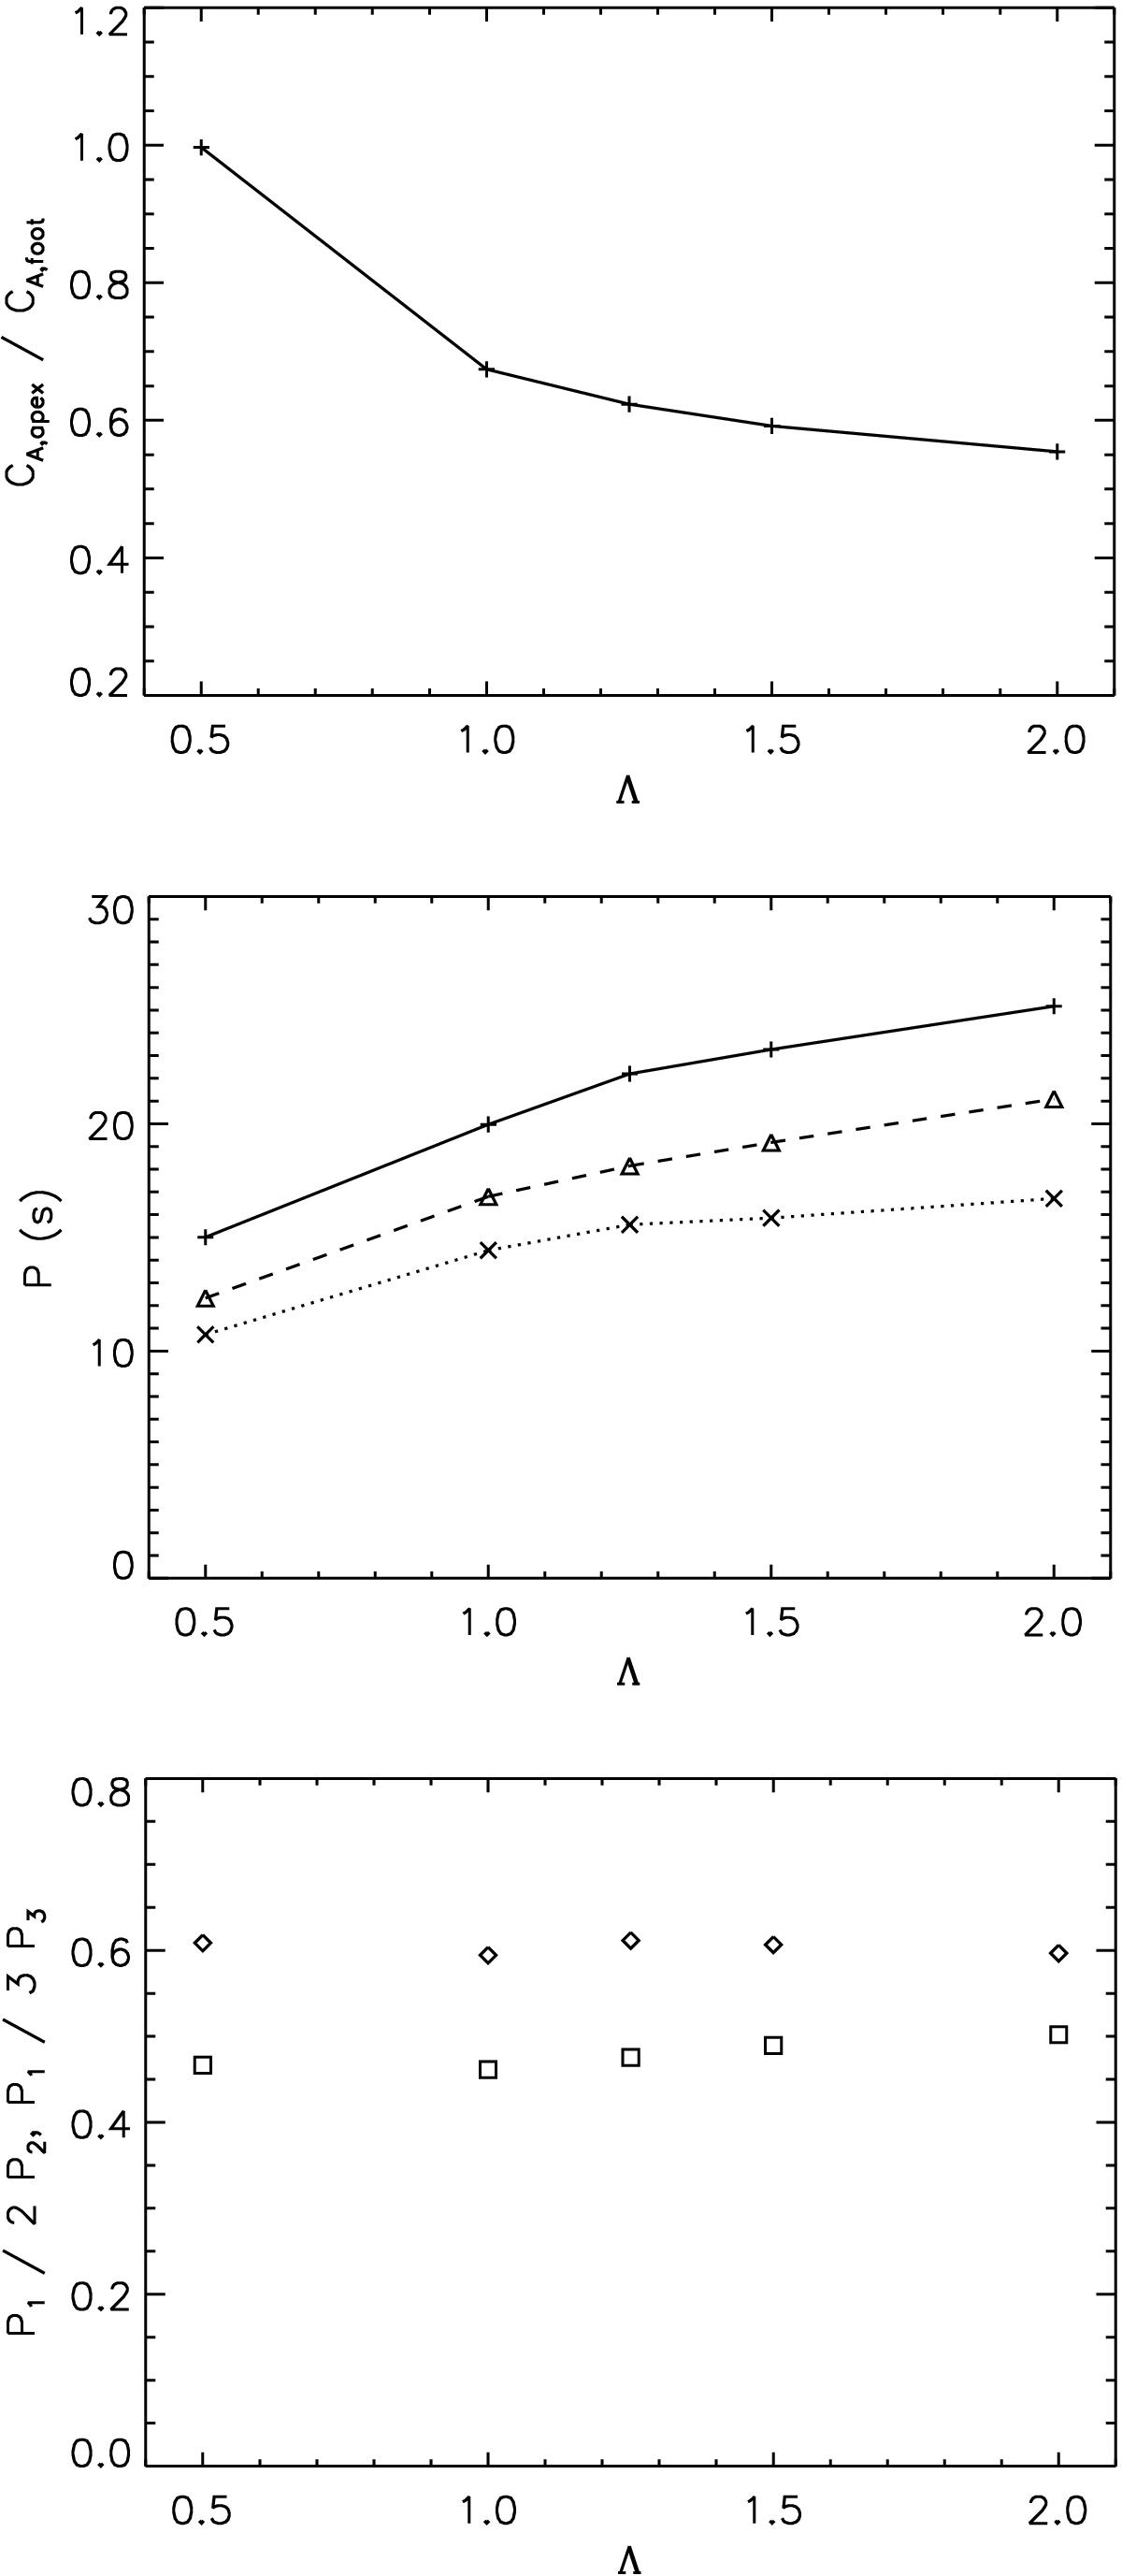
Dependence of loop parameters as a function of the density stratification parameter Λ. Top: ratio of Alfvén speed at the loop apex and loop footpoint. Middle: period of oscillation; P1, P2, and P3 are represented by plus signs, triangles and crosses, respectively. Bottom: period ratios P1/ 2P2 (triangles) and P1/ 3P3 (squares).
Current usage metrics show cumulative count of Article Views (full-text article views including HTML views, PDF and ePub downloads, according to the available data) and Abstracts Views on Vision4Press platform.
Data correspond to usage on the plateform after 2015. The current usage metrics is available 48-96 hours after online publication and is updated daily on week days.
Initial download of the metrics may take a while.