Fig. 7
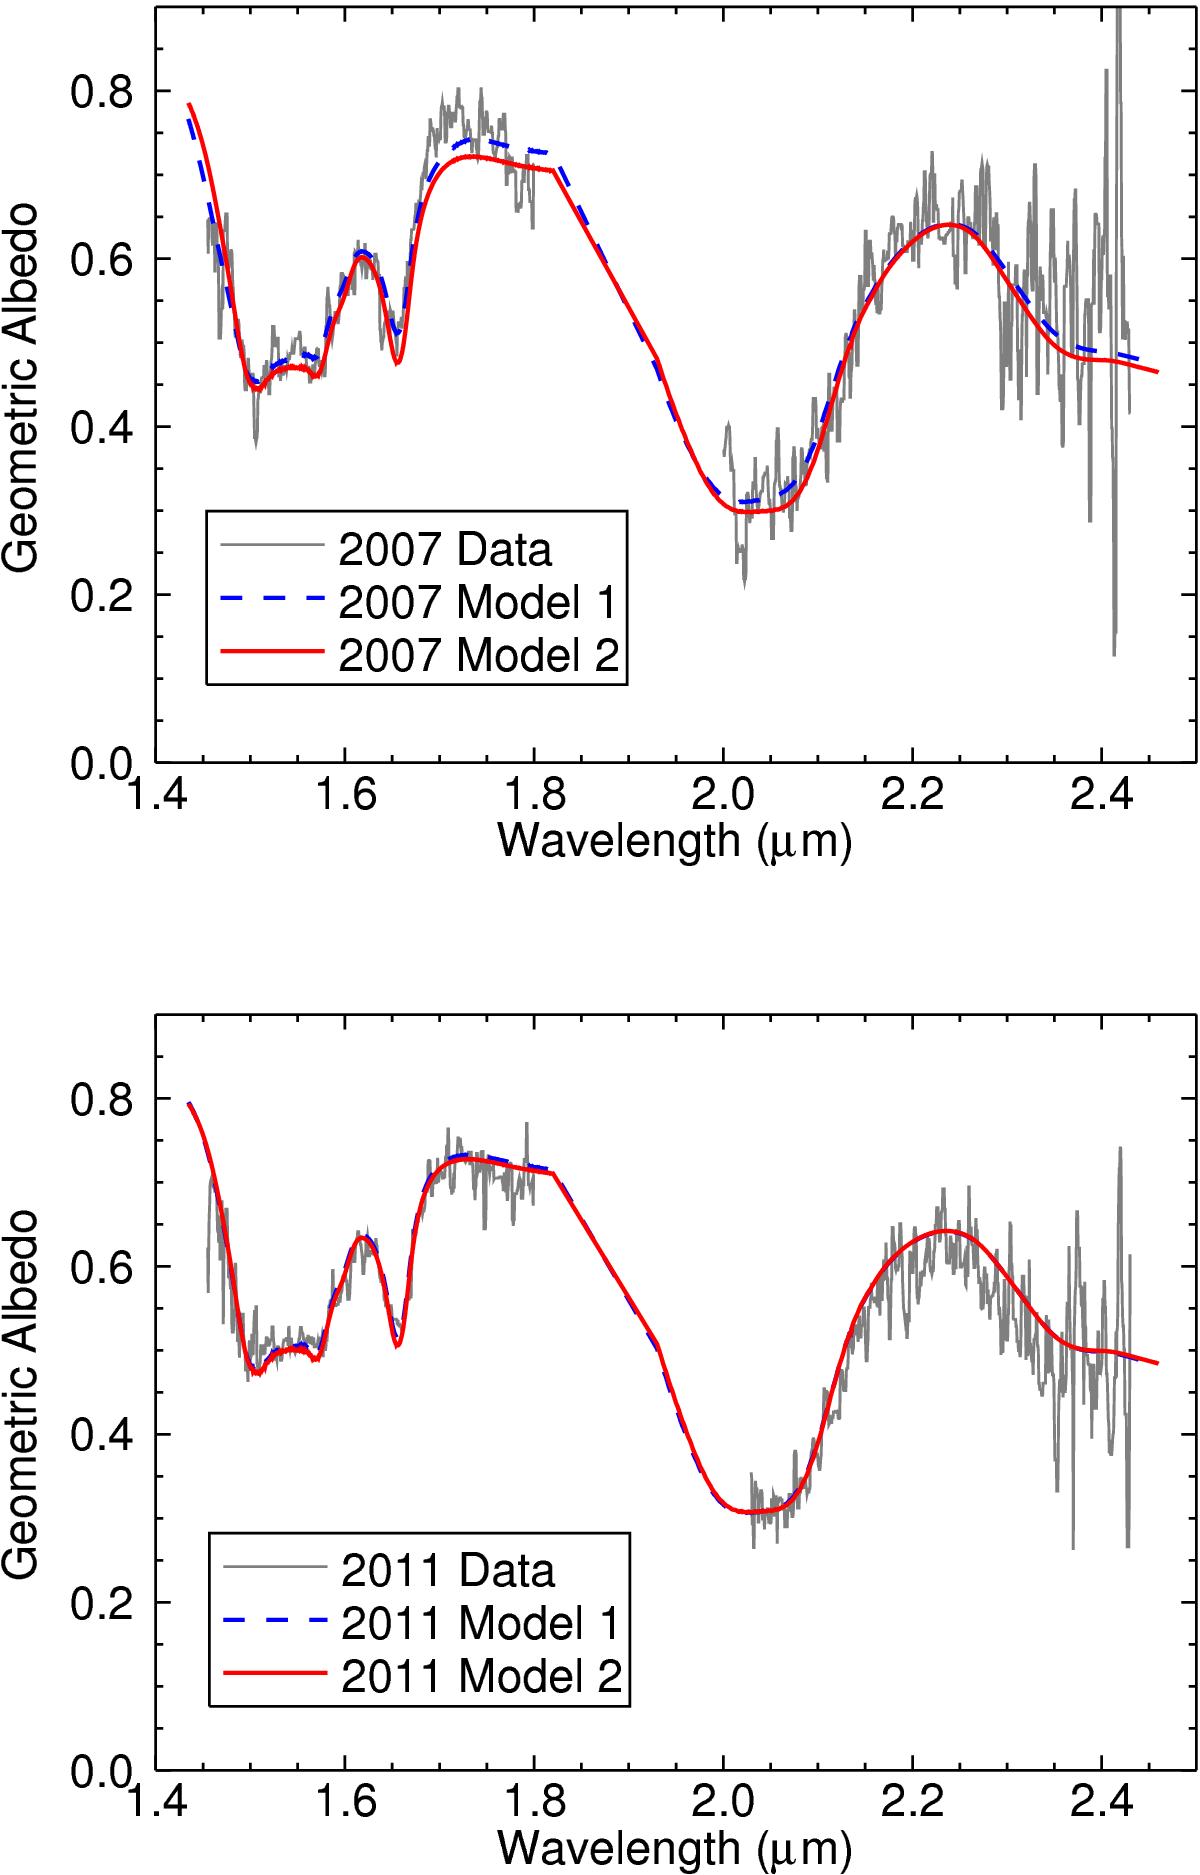
Spectra of Haumea (in gray) taken on 2007 (DRS, top figure) and 2011 (no-DRS, bottom figure; excluding data point H11_6, which is right on top of the DRS). The results of our spectral modeling is shown with red and blue lines. Crystalline water ice with grain sizes smaller than 60 μm as the major component, with only a few percent of amorphous carbon, are sufficient to fit our data nicely (Model 1, in blue dashed line). However, slight improvements to the fit can be obtained by adding ~10% of amorphous water ice (Model 2, in solid red line). See Table 2 for more details on the models.
Current usage metrics show cumulative count of Article Views (full-text article views including HTML views, PDF and ePub downloads, according to the available data) and Abstracts Views on Vision4Press platform.
Data correspond to usage on the plateform after 2015. The current usage metrics is available 48-96 hours after online publication and is updated daily on week days.
Initial download of the metrics may take a while.