Fig. 6
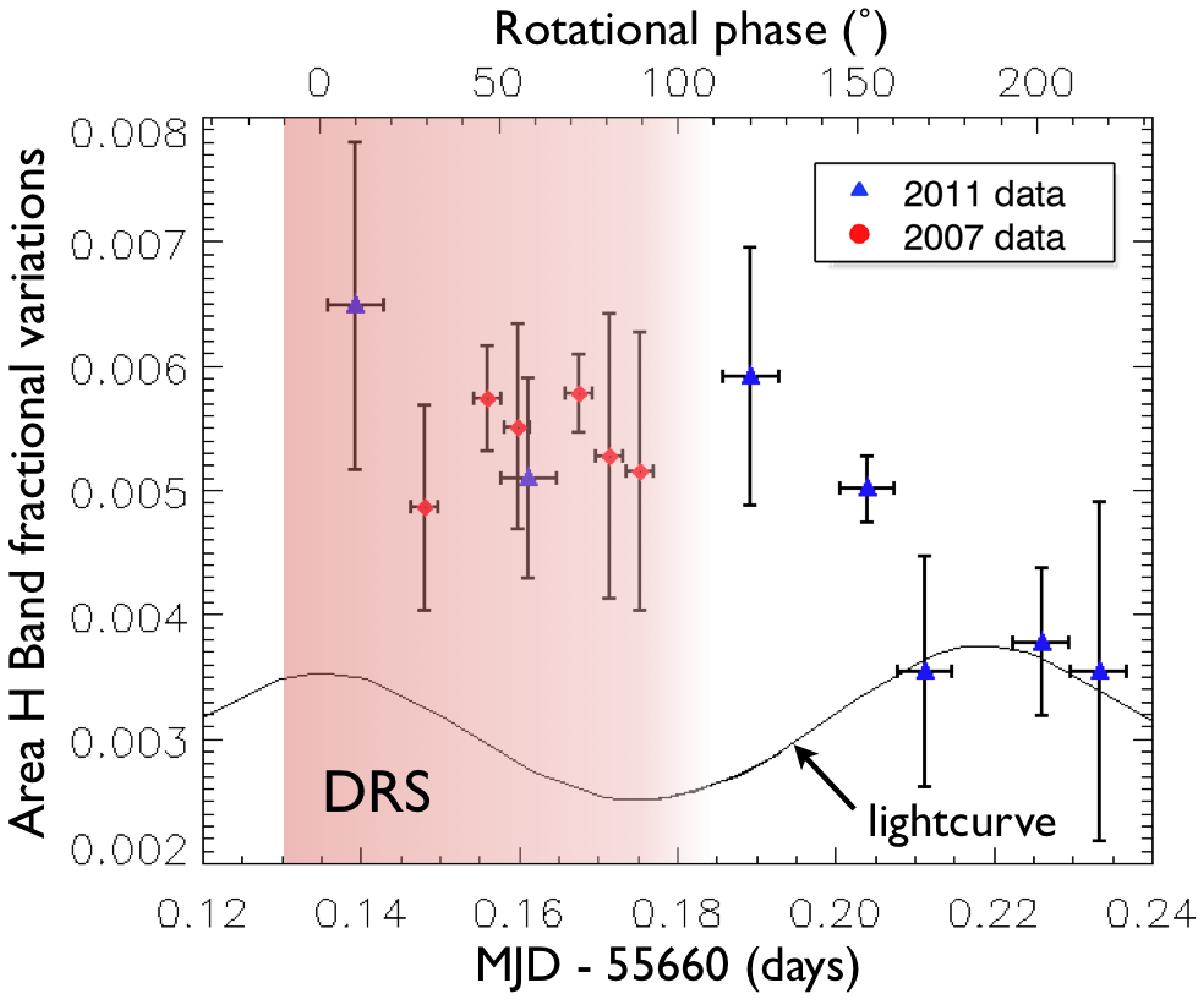
Variation of the integrated area of the [1.50−1.63] μm H2O ice complex band as a function of time (MJD − 55 660 days). The 2007 data have been shifted by an integer number of rotational period so that they can be overplotted on the 2011 data (see Table 1). The red circles and blue triangles correspond to the 2007 and 2011 data, respectively. The errors represented are 1σ for both data. Haumea’s light curve (solid line) is also represented for clarity. We see that the strongest H-band absorptions are localized in the DRS region.
Current usage metrics show cumulative count of Article Views (full-text article views including HTML views, PDF and ePub downloads, according to the available data) and Abstracts Views on Vision4Press platform.
Data correspond to usage on the plateform after 2015. The current usage metrics is available 48-96 hours after online publication and is updated daily on week days.
Initial download of the metrics may take a while.