Fig. 4
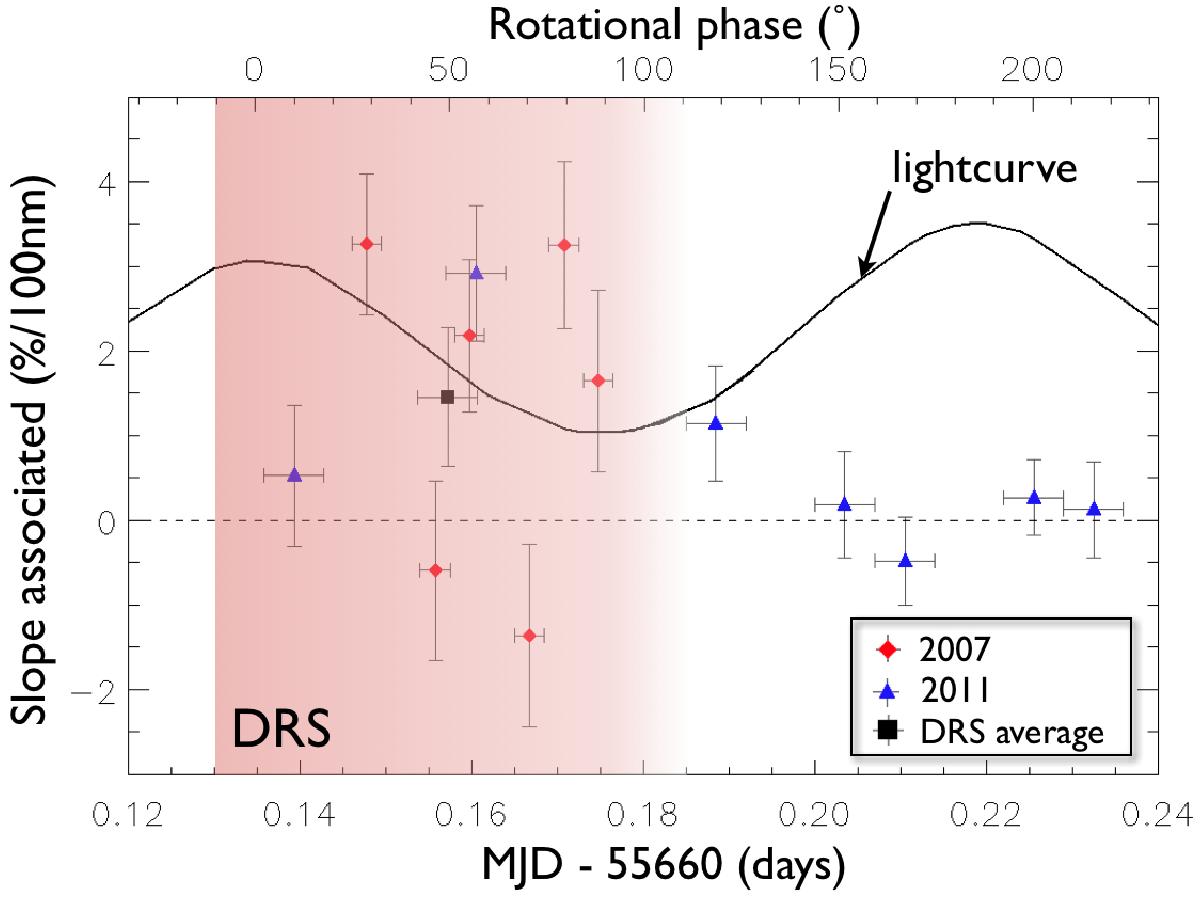
Representation of the spectral slopes (%/100 nm) from Fig. 3 as a function of time (in MJD-55 660 days). The rotational phase (longitude) is also represented on the top axis in degrees. The 2007 data have been shifted by an integer number of rotational period so that they can be overplotted on the 2011 data (see Table 1). The red circles and blue triangles correspond to the 2007 and 2011 data, respectively. A null slope corresponding to the no-DRS part (dashed line) and the black square represents the average of the slope values in the DRS equal to [1.46 ± 0.82]%/100 nm, highlighting the redder spectral slope for this region of the surface of Haumea. The error bars correspond to a standard deviation of 1σ. Haumea’s light curve (solid line) is also represented for clarity.
Current usage metrics show cumulative count of Article Views (full-text article views including HTML views, PDF and ePub downloads, according to the available data) and Abstracts Views on Vision4Press platform.
Data correspond to usage on the plateform after 2015. The current usage metrics is available 48-96 hours after online publication and is updated daily on week days.
Initial download of the metrics may take a while.