Fig. 3
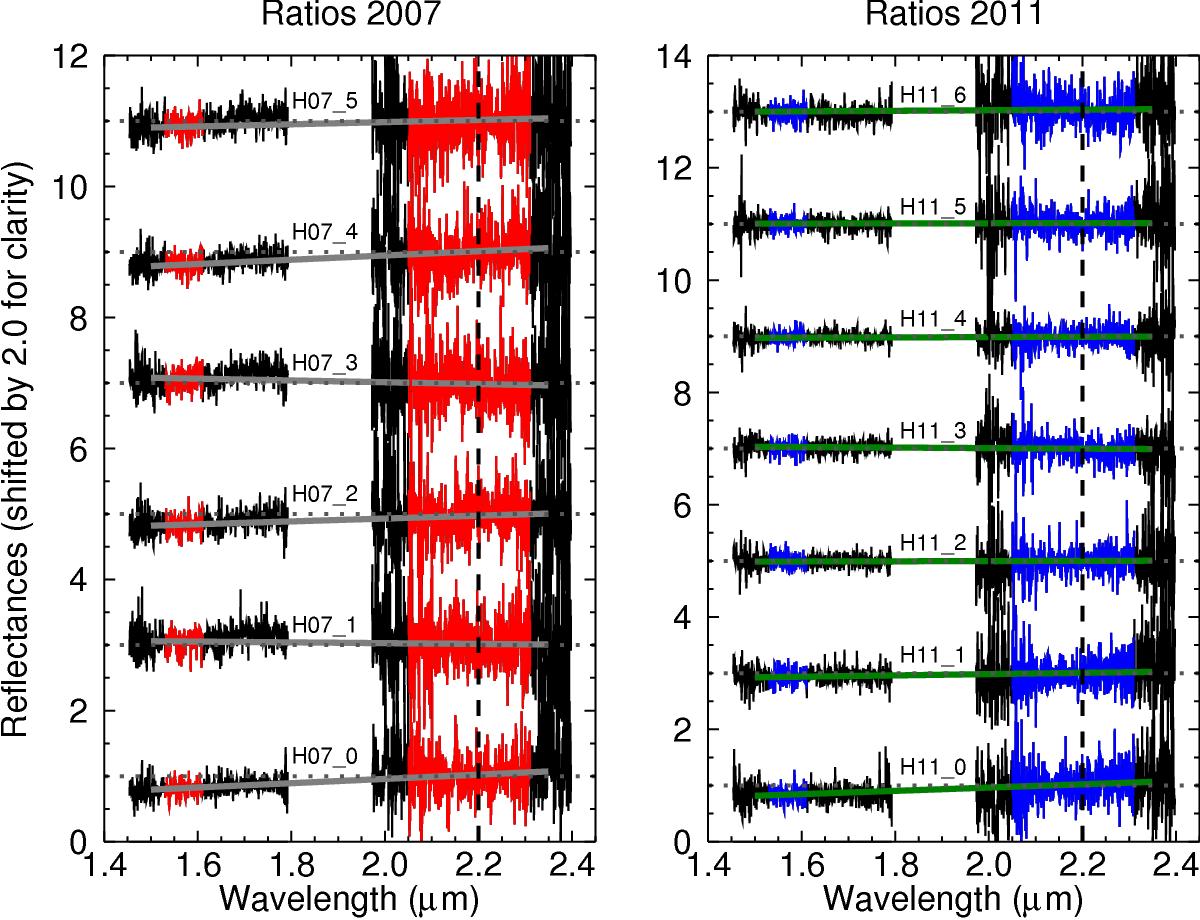
Comparison of the spectra ratios obtained by dividing each spectrum by the average spectrum of the no-DRS region (H11_x with x = [2,3,4,5]). The slope is calculated considering the wavelength ranges 1.51−1.63 μm and 2.03−2.30 μm (red and blue parts for 2007 and 2011, respectively) and a simple linear regression. All spectra have been normalized at 2.20 μm (dashed line). The variation of the spectral slopes obtained for each spectra as a function of time is represented in Fig. 4.
Current usage metrics show cumulative count of Article Views (full-text article views including HTML views, PDF and ePub downloads, according to the available data) and Abstracts Views on Vision4Press platform.
Data correspond to usage on the plateform after 2015. The current usage metrics is available 48-96 hours after online publication and is updated daily on week days.
Initial download of the metrics may take a while.