Fig. 2
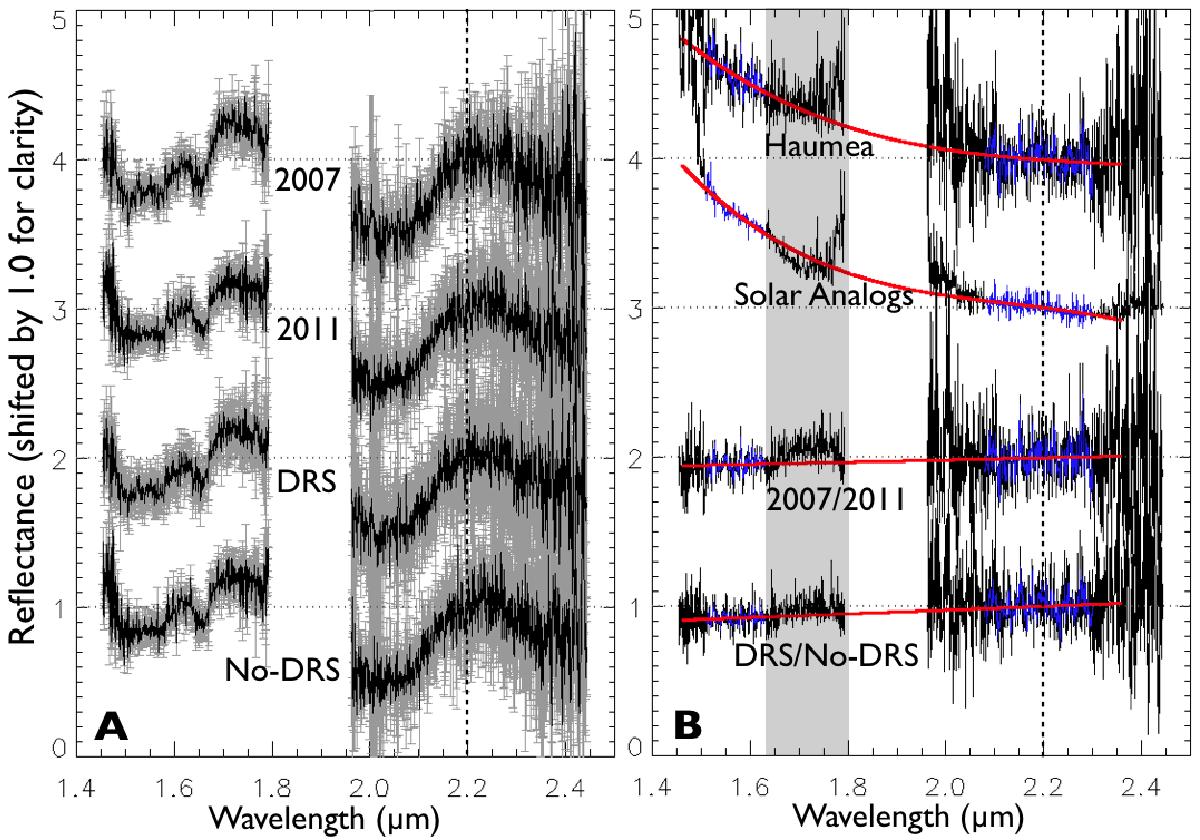
A) Average spectra of Haumea obtained for each date (top) and for both regions: the DRS (including all the 2007 observations with H11_0 and H11_6) and no-DRS (all combined H11_x with x = [1..5]). See Table 1 and Fig. 1 for notations. The standard deviation at 1σ is also represented for each spectrum. Water-ice features are clearly visible at 1.5 μm, 1.65 μm (crystalline), and with the large band at 2.0 μm, but no significant differences were observed between each regions. All spectra were normalized at 2.20 μm (dashed line). B) Spectral ratios between the two data sets of 2007 and 2011: top: division of the two average spectra of Haumea and that of the two solar analogs. We note the bump observed in the 1.63−1.80 μm range (gray region), which is due to an artifact of the solar analog calibration star (see Dumas et al. 2011 for more explanation). Bottom: the ratio of the spectra 2007/2011 and DRS/no-DRS. The blue parts of the spectra correspond to the wavelengths range (1.51−1.63 μm in H and 2.03−2.30 μm in K) used to fit the polynomial regressions (red curves). The slopes are [0.81 ± 0.60]%/100 nm and [1.49 ± 0.60]%/100 nm for the 2007/2011 and DRS/no-DRS ratios, respectively, and they confirm the redder profile of the DRS region.
Current usage metrics show cumulative count of Article Views (full-text article views including HTML views, PDF and ePub downloads, according to the available data) and Abstracts Views on Vision4Press platform.
Data correspond to usage on the plateform after 2015. The current usage metrics is available 48-96 hours after online publication and is updated daily on week days.
Initial download of the metrics may take a while.