Fig. 1
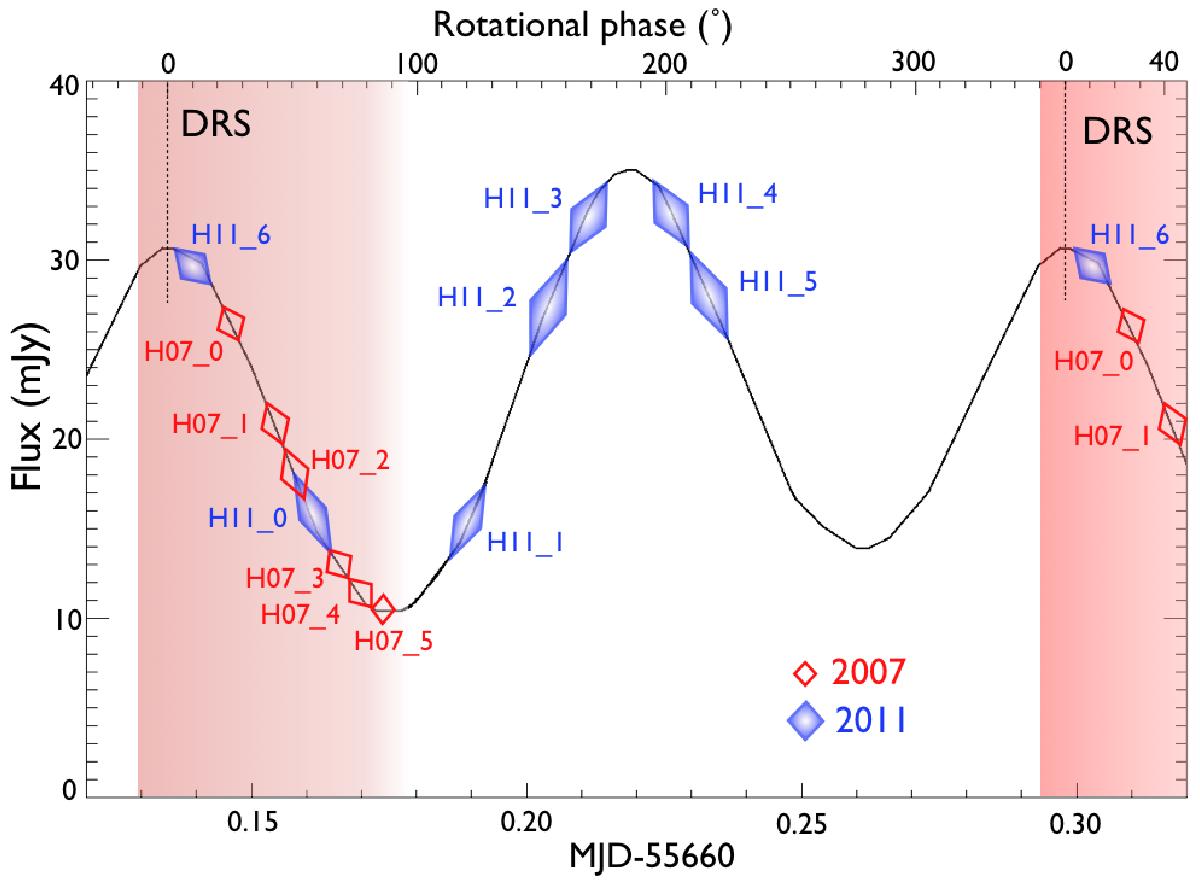
Positions of all observed epochs (six for 2007 and seven for 2011, see Table 1 for notations) onto Haumea’s light curve. The location of the Dark Red Spot (Lacerda 2009) is represented by the red-shaded region. The combination of the data obtained on both dates returns the 230 degrees of rotational coverage of Haumea. The 2007 observations published in (Dumas et al. 2011) can be used to characterize the DRS region. The rotational phase (longitude) is also represented in degrees along the X-axis. The size of the diamond is proportional to the timespan between the start and end of each observation. with typical exposure times of 300 s in 2007 and 600 s in 2011. Haumea’s light curve is taken from Lellouch et al. (2010). The longitude uncertainties are not represented because they are too small (less than 0.13% and 0.07% over the period covering the 2007 and 2011 data).
Current usage metrics show cumulative count of Article Views (full-text article views including HTML views, PDF and ePub downloads, according to the available data) and Abstracts Views on Vision4Press platform.
Data correspond to usage on the plateform after 2015. The current usage metrics is available 48-96 hours after online publication and is updated daily on week days.
Initial download of the metrics may take a while.