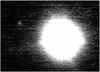
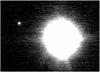
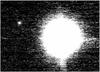
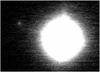
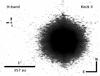
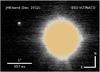
Fig. A.4

Direct images of CVSO 30 c. Top row, left to right: quasi-simultaneous VLT NACO J-, H-, and Ks-band data, taken in a sequence and shown in the same percentage of upper cut-off and lower cut-off value 0. Lower row, left to right: VLT NACO J-band with double exposure time per single image, the same in total, Keck image of data by van Eyken et al. (2012), re-reduced. We note that the companion is north-east, not a contaminant south-east, as given in van Eyken et al. (2012), and a JHKs colour composite, showing that CVSO 30 c has similar colours as its host star (Fig. 2).
Current usage metrics show cumulative count of Article Views (full-text article views including HTML views, PDF and ePub downloads, according to the available data) and Abstracts Views on Vision4Press platform.
Data correspond to usage on the plateform after 2015. The current usage metrics is available 48-96 hours after online publication and is updated daily on week days.
Initial download of the metrics may take a while.