Fig. A.3
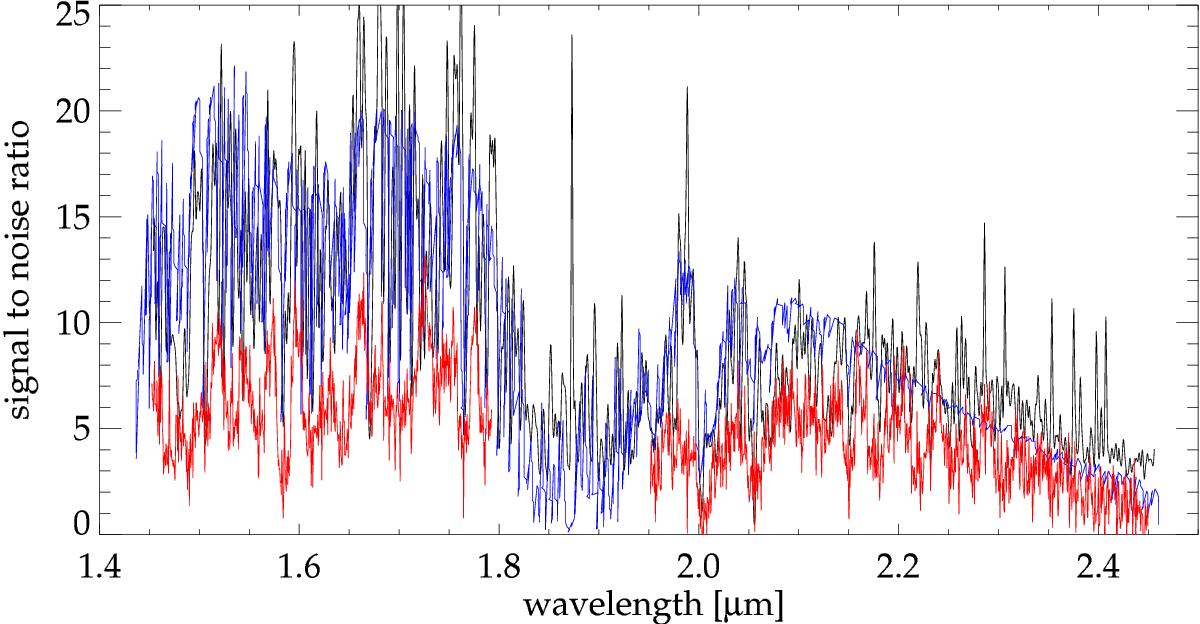
Signal-to-noise ratio (S/N) achieved for the brightest pixel vs. the background noise in the combined cube (black). For comparison the expected and almost identical S/N is shown, simulated using the exposure time calculator (ETC) of ESO/SINFONI (blue). In red we present the final achieved S/N of the extracted companion spectrum after removing a superimposed spike (Fig. 3), as shown in Fig. 4.
Current usage metrics show cumulative count of Article Views (full-text article views including HTML views, PDF and ePub downloads, according to the available data) and Abstracts Views on Vision4Press platform.
Data correspond to usage on the plateform after 2015. The current usage metrics is available 48-96 hours after online publication and is updated daily on week days.
Initial download of the metrics may take a while.