Fig. 9
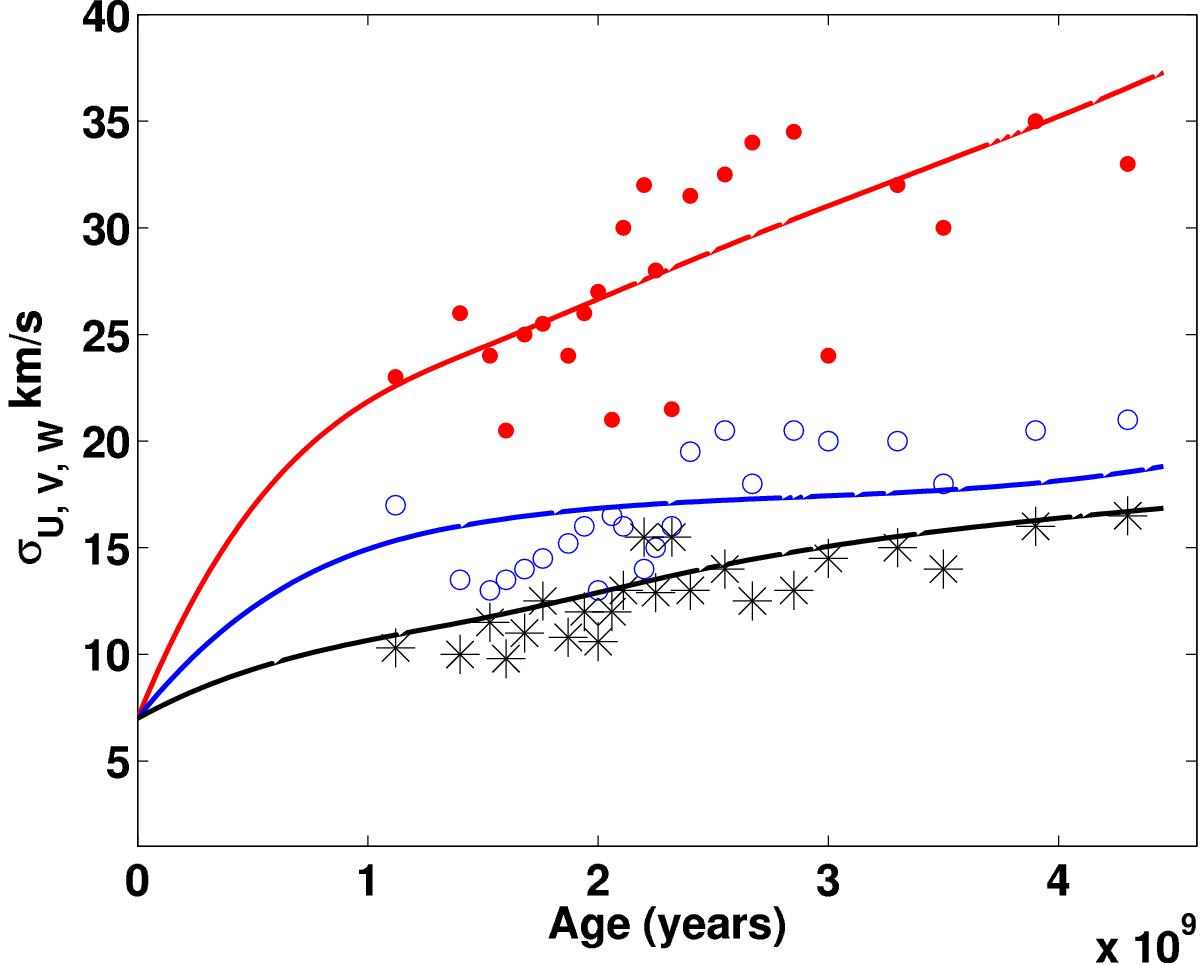
Dispersions σU8 (red lines), σV8 (blue lines) and σW8 (black lines) in U, V and W velocity components, respectively, calculated for stars around R = 8 kpc in a BGS simulation (i.e. with bar, GMCs and spiral arms included), full lines, and when crossing the Galactic plane (for σW). Also plotted are the stellar observations of Holmberg et al. (2009) as dots (U: full, V: open) and asterisks (W), with a colour coding corresponding to that used for the models.
Current usage metrics show cumulative count of Article Views (full-text article views including HTML views, PDF and ePub downloads, according to the available data) and Abstracts Views on Vision4Press platform.
Data correspond to usage on the plateform after 2015. The current usage metrics is available 48-96 hours after online publication and is updated daily on week days.
Initial download of the metrics may take a while.