Fig. 5
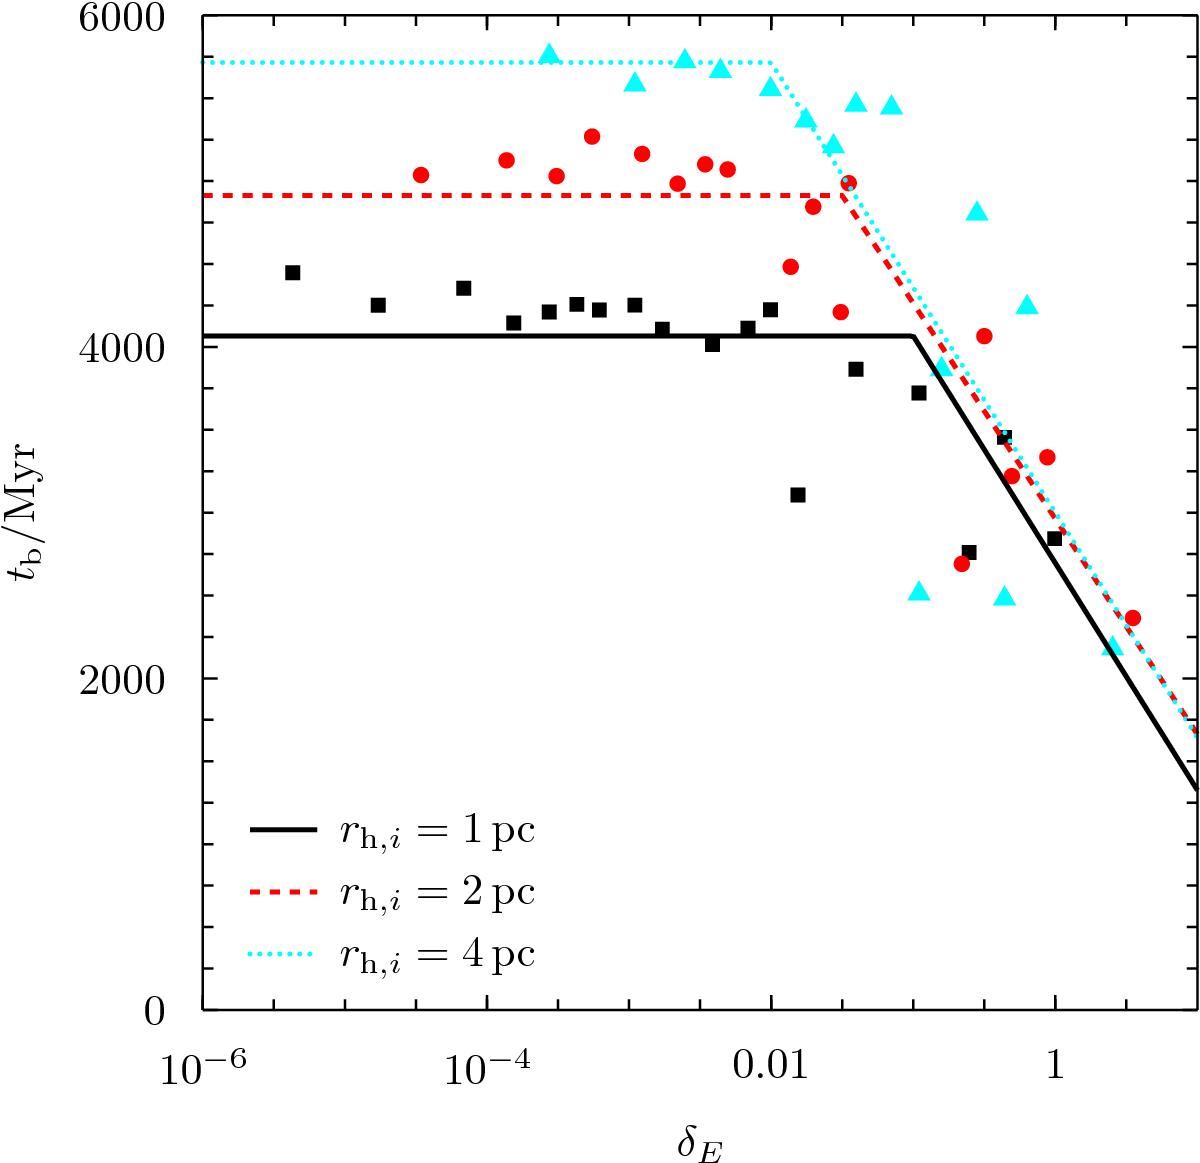
Behaviour of tb, break time in the fits of N with t, as a function of predicted δE. Model clusters with initial half-mass radii of 1, 2, and 4 pc are shown by black squares, red circles and blue triangles respectively. The solid black, dashed red and dotted blue lines show the fits adopted to the results for half-mass radii of 1, 2, and 4 pc respectively.
Current usage metrics show cumulative count of Article Views (full-text article views including HTML views, PDF and ePub downloads, according to the available data) and Abstracts Views on Vision4Press platform.
Data correspond to usage on the plateform after 2015. The current usage metrics is available 48-96 hours after online publication and is updated daily on week days.
Initial download of the metrics may take a while.